03 管理接口
Envoy内建了一个管理接口,它支持查询和修改操作,甚至有可能暴露私有数据(例如统计数据、集群名称和证书信息等),因此非常有必要精心编排其访问控制机制以避免非授权访问;在bootstrap配置文件的admin字段下进行配置:
admin: # 管理接口的配置段
  access_log_path: ...     # 管理接口的访问日志文件路径,无须记录访问日志时使用/dev/null;
  profile_path: ...        # cpu profiler的输出路径,默认为/var/log/envoy/envoy.prof;
  address:                 # 监听的套接字;
    socket_address:
      protocol: ...
      address: ...
      port_value: ...
下面是一个简单的配置示例:
admin:
  access_log_path: /tmp/admin_access.log
  address:
    socket_address: { address: 127.0.0.1, port_value: 9901 }
admin接口内置了多个/path,不同的path可能会分别接受不同的GET或 POST请求;
GET /help:打印所有可用选项;
admin commands are:
GET /		: Admin home page  #
GET /certs		: print certs on machine  # 列出已加载的所有TLS证书及相关的信息;
GET /clusters		: upstream cluster status # 额外支持使用“GET /clusters?format=json”
GET /config_dump		: dump current Envoy configs (experimental) # 打印Envoy加载的各类配置信息;
GET /contention		: dump current Envoy mutex contention stats (if enabled) # ,互斥跟踪
POST /cpuprofiler		: enable/disable the CPU profiler              # ,启用或禁用cpuprofiler(cpu性能剖析)
POST /healthcheck/fail		: cause the server to fail health checks  # 强制设定HTTP健康状态检查为失败;
POST /healthcheck/ok		: cause the server to pass health checks    # 强制设定HTTP健康状态检查为成功;
POST /heapprofiler		: enable/disable the heap profiler            # 启用或禁用heapprofiler;
GET /help		: print out list of admin commands  #打印当前帮助
GET /hot_restart_version		: print the hot restart compatibility version # 打印热重启相关的信息;
GET /listeners		: print listener addresses # 列出所有侦听器,支持使用“GET /listeners?format=json”
POST /logging		: query/change logging levels # 启用或禁用不同子组件上的不同日志记录级别
POST /memory		: print current allocation/heap usage # 打印当前内在分配信息,以字节为单位;
POST /quitquitquit		: exit the server # 干净退出服务器;
POST /reset_counters		: reset all counters to zero # 重置所有计数器;
GET /runtime		: print runtime values # 以json格式输出所有运行时相关值;
POST /runtime_modify		: modify runtime values # /runtime_modify?key1=value1&key2=value2,添加或修改在查询参数中传递的运行时值
GET /server_info		: print server version/status information # 打印当前Envoy Server的相关信息;
GET /stats					: print server stats # 按需输出统计数据,例如GET /stats?filter=<regex>,另外还支持json和prometheus两种输出格式;
GET /stats/prometheus		: print server stats in prometheus format  #输出prometheus格式的统计信息;
列出所有已配置的集群,包括每个集群中发现的所有上游主机以及每个主机的统计信息;支持输出为json格式;
- 集群管理器信息:“version_info string”,无CDS时,则显示为“version_info::static”
- 集群相关的信息:断路器、异常点检测和用于表示是否通过CDS添加的标识“add_via_api”
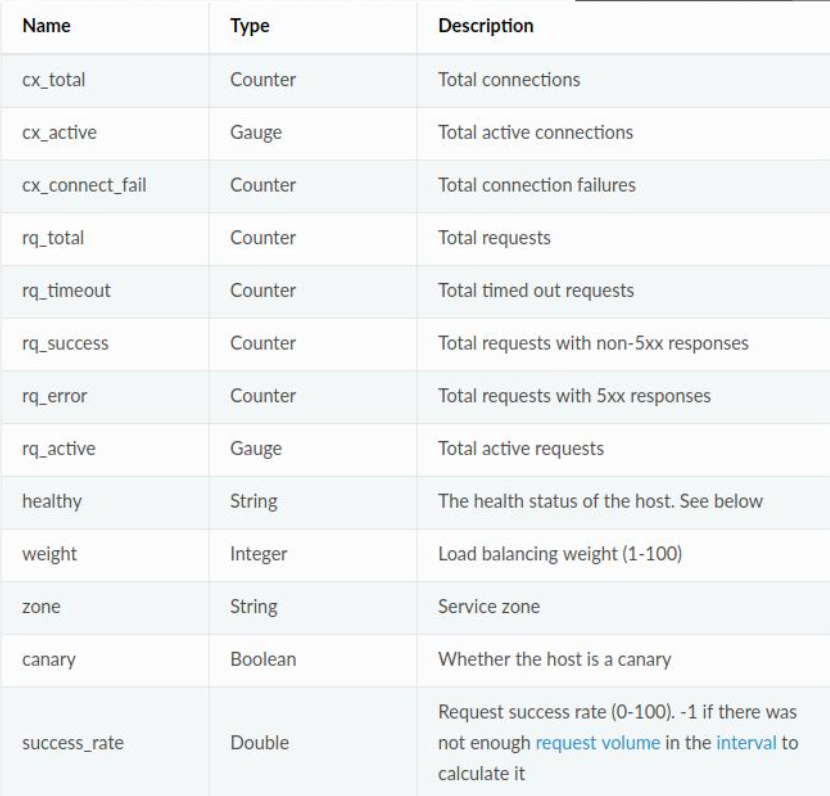
- 每个主机的统计信息:包括总连接数、活动连接数、总请求数和主机的健康状态等;不健康的原因通 常有以下三种
- failed_active_hc:未通过主动健康状态检测;
- failed_eds_health:被EDS标记为不健康;
- failed_outlier_check:未通过异常检测机制的检查;
root@ubuntu1:~# curl 172.26.0.2:9901/clusters
webcluster1::default_priority::max_connections::1024
webcluster1::default_priority::max_pending_requests::1024
webcluster1::default_priority::max_requests::1024
webcluster1::default_priority::max_retries::3
webcluster1::high_priority::max_connections::1024
webcluster1::high_priority::max_pending_requests::1024
webcluster1::high_priority::max_requests::1024
webcluster1::high_priority::max_retries::3
webcluster1::added_via_api::false
webcluster1::172.26.0.3:8081::cx_active::0
webcluster1::172.26.0.3:8081::cx_connect_fail::0
webcluster1::172.26.0.3:8081::cx_total::0
webcluster1::172.26.0.3:8081::rq_active::0
webcluster1::172.26.0.3:8081::rq_error::0
webcluster1::172.26.0.3:8081::rq_success::0
webcluster1::172.26.0.3:8081::rq_timeout::0
webcluster1::172.26.0.3:8081::rq_total::0
webcluster1::172.26.0.3:8081::hostname::
webcluster1::172.26.0.3:8081::health_flags::healthy
webcluster1::172.26.0.3:8081::weight::1
webcluster1::172.26.0.3:8081::region::
webcluster1::172.26.0.3:8081::zone::
webcluster1::172.26.0.3:8081::sub_zone::
webcluster1::172.26.0.3:8081::canary::false
webcluster1::172.26.0.3:8081::priority::0
webcluster1::172.26.0.3:8081::success_rate::-1
webcluster1::172.26.0.3:8081::local_origin_success_rate::-1
webcluster1::172.26.0.4:8081::cx_active::0
webcluster1::172.26.0.4:8081::cx_connect_fail::0
webcluster1::172.26.0.4:8081::cx_total::0
webcluster1::172.26.0.4:8081::rq_active::0
webcluster1::172.26.0.4:8081::rq_error::0
webcluster1::172.26.0.4:8081::rq_success::0
webcluster1::172.26.0.4:8081::rq_timeout::0
webcluster1::172.26.0.4:8081::rq_total::0
webcluster1::172.26.0.4:8081::hostname::
webcluster1::172.26.0.4:8081::health_flags::healthy
webcluster1::172.26.0.4:8081::weight::1
webcluster1::172.26.0.4:8081::region::
webcluster1::172.26.0.4:8081::zone::
webcluster1::172.26.0.4:8081::sub_zone::
webcluster1::172.26.0.4:8081::canary::false
webcluster1::172.26.0.4:8081::priority::0
webcluster1::172.26.0.4:8081::success_rate::-1
webcluster1::172.26.0.4:8081::local_origin_success_rate::-1
列出所有已配置的侦听器,包括侦听器的名称以及监听的地址;支持输出 为json格式;
root@ubuntu1:~# curl 172.26.0.2:9901/listeners
listener_http::0.0.0.0:80
以json格式打印当前从Envoy的各种组件加载的配置信息;
root@ubuntu1:~# curl 172.26.0.2:9901/config_dump
{
 "configs": [
  {
   "@type": "type.googleapis.com/envoy.admin.v2alpha.BootstrapConfigDump",
   "bootstrap": {
    "node": {
     "id": "envoy_001",
     "cluster": "testcluster",
     "build_version": "e349fb6139e4b7a59a9a359be0ea45dd61e589c5/1.11.1/Clean/RELEASE/BoringSSL"
    },
    "static_resources": {
     "listeners": [
      {
       "name": "listener_http",
       "address": {
        "socket_address": {
         "address": "0.0.0.0",
         "port_value": 80
        }
       },
       "filter_chains": [
        {
         "filters": [
          {
           "name": "envoy.http_connection_manager",
           "config": {
            "route_config": {
             "name": "test_route",
             "virtual_hosts": [
              {
               "routes": [
                {
                 "route": {
                  "cluster": "webcluster1"
                 },
                 "match": {
                  "prefix": "/"
                 }
                }
               ],
               "domains": [
                "*"
               ],
               "name": "web_service_1"
              }
             ]
            },
            "codec_type": "AUTO",
            "http_filters": [
             {
              "name": "envoy.router"
             }
            ],
            "stat_prefix": "egress_http"
           }
          }
         ]
        }
       ]
      }
     ],
     "clusters": [
      {
       "name": "webcluster1",
       "type": "EDS",
       "eds_cluster_config": {
        "eds_config": {
         "path": "/etc/envoy/eds.conf"
        },
        "service_name": "webcluster1"
       },
       "connect_timeout": "0.250s"
      }
     ]
    },
    "admin": {
     "access_log_path": "/tmp/admin_access.log",
     "address": {
      "socket_address": {
       "address": "0.0.0.0",
       "port_value": 9901
      }
     }
    }
   },
   "last_updated": "2021-10-24T10:47:09.620Z"
  },
  {
   "@type": "type.googleapis.com/envoy.admin.v2alpha.ClustersConfigDump",
   "static_clusters": [
    {
     "cluster": {
      "name": "webcluster1",
      "type": "EDS",
      "eds_cluster_config": {
       "eds_config": {
        "path": "/etc/envoy/eds.conf"
       },
       "service_name": "webcluster1"
      },
      "connect_timeout": "0.250s"
     },
     "last_updated": "2021-10-24T10:47:09.622Z"
    }
   ]
  },
  {
   "@type": "type.googleapis.com/envoy.admin.v2alpha.ListenersConfigDump",
   "static_listeners": [
    {
     "listener": {
      "name": "listener_http",
      "address": {
       "socket_address": {
        "address": "0.0.0.0",
        "port_value": 80
       }
      },
      "filter_chains": [
       {
        "filters": [
         {
          "name": "envoy.http_connection_manager",
          "config": {
           "http_filters": [
            {
             "name": "envoy.router"
            }
           ],
           "stat_prefix": "egress_http",
           "route_config": {
            "name": "test_route",
            "virtual_hosts": [
             {
              "routes": [
               {
                "route": {
                 "cluster": "webcluster1"
                },
                "match": {
                 "prefix": "/"
                }
               }
              ],
              "domains": [
               "*"
              ],
              "name": "web_service_1"
             }
            ]
           },
           "codec_type": "AUTO"
          }
         }
        ]
       }
      ]
     },
     "last_updated": "2021-10-24T10:47:09.624Z"
    }
   ]
  },
  {
   "@type": "type.googleapis.com/envoy.admin.v2alpha.ScopedRoutesConfigDump"
  },
  {
   "@type": "type.googleapis.com/envoy.admin.v2alpha.RoutesConfigDump",
   "static_route_configs": [
    {
     "route_config": {
      "name": "test_route",
      "virtual_hosts": [
       {
        "name": "web_service_1",
        "domains": [
         "*"
        ],
        "routes": [
         {
          "match": {
           "prefix": "/"
          },
          "route": {
           "cluster": "webcluster1"
          }
         }
        ]
       }
      ]
     },
     "last_updated": "2021-10-24T10:47:09.623Z"
    }
   ]
  }
 ]
}
获取Server就绪与否的状态,LIVE状态为200,否则为503;
root@ubuntu1:~# curl 172.26.0.2:9901/ready
LIVE
将所有计数器重围为0;不过,它只会影响Server本地的输出,对于已经发送到外部存储系统的统计数据无效;