访问iptables Svc各情形分析
apiVersion: apps/v1
kind: Deployment
metadata:
  name: myapp
  namespace: default
spec:
  replicas: 3
  selector:
    matchLabels:
      app: myapp
      release: canary
  strategy:
    type: RollingUpdate
    rollingUpdate:
      maxSurge: 1
      maxUnavailable: 1
  template:
    metadata:
      name: myapp
      labels:
        app: myapp
        release: canary
    spec:
      containers:
      - name: myapp
        image:  registry-jinan-lab.inspurcloud.cn/testljz/myapp:v1
        ports:
        - name: http
          containerPort: 80
---
apiVersion: v1
kind: Service
metadata:
  name: myapp
  namespace: default
spec:
  ports:
  - port: 80
    protocol: TCP
    targetPort: 80
  selector:
    app: myapp
    release: canary
  sessionAffinity: None
  type: ClusterIP
root@4906e91c-f6a7-4686-945b-535203f14695-master-1:~# kubectl get svc myapp
NAME    TYPE        CLUSTER-IP     EXTERNAL-IP   PORT(S)   AGE
myapp   ClusterIP   10.150.18.86   <none>        80/TCP    62m

root@4906e91c-f6a7-4686-945b-535203f14695-master-1:~# kubectl get pod -owide |grep  myapp
myapp-5d749dc84b-g6mn6   1/1     Running   0          63m   10.151.49.8   slave2   <none>           <none>
myapp-5d749dc84b-lt4ss   1/1     Running   0          63m   10.151.51.8   slave1   <none>           <none>
myapp-5d749dc84b-tmd49   1/1     Running   0          63m   10.151.51.7   slave1   <none>           <none>
- pod-cidr:10.151.0.0/16
- svc-cidr:10.150.0.0/16
- Slave1:172.16.1.50 ;slave2:172.16.1.88
root@4906e91c-f6a7-4686-945b-535203f14695-slave-1:~# ip a
1: lo: <LOOPBACK,UP,LOWER_UP> mtu 65536 qdisc noqueue state UNKNOWN group default qlen 1000
    link/loopback 00:00:00:00:00:00 brd 00:00:00:00:00:00
    inet 127.0.0.1/8 scope host lo
       valid_lft forever preferred_lft forever
    inet6 ::1/128 scope host
       valid_lft forever preferred_lft forever
2: ens3: <BROADCAST,MULTICAST,UP,LOWER_UP> mtu 1500 qdisc fq_codel state UP group default qlen 1000
    link/ether fa:16:3e:92:11:ca brd ff:ff:ff:ff:ff:ff
    inet 172.16.1.50/12 brd 172.31.255.255 scope global ens3
       valid_lft forever preferred_lft forever
    inet6 fe80::f816:3eff:fe92:11ca/64 scope link
       valid_lft forever preferred_lft forever
3: docker0: <NO-CARRIER,BROADCAST,MULTICAST,UP> mtu 1500 qdisc noqueue state DOWN group default
    link/ether 02:42:ff:96:6a:06 brd ff:ff:ff:ff:ff:ff
    inet 172.17.0.1/16 brd 172.17.255.255 scope global docker0
       valid_lft forever preferred_lft forever
    inet6 fe80::42:ffff:fe96:6a06/64 scope link
       valid_lft forever preferred_lft forever
8: tunl0@NONE: <NOARP,UP,LOWER_UP> mtu 1480 qdisc noqueue state UNKNOWN group default qlen 1000
    link/ipip 0.0.0.0 brd 0.0.0.0
    inet 10.151.51.0/32 brd 10.151.51.0 scope global tunl0
       valid_lft forever preferred_lft forever
11: califf8f2a54a89@if4: <BROADCAST,MULTICAST,UP,LOWER_UP> mtu 1480 qdisc noqueue state UP group default
    link/ether ee:ee:ee:ee:ee:ee brd ff:ff:ff:ff:ff:ff link-netnsid 0
    inet6 fe80::ecee:eeff:feee:eeee/64 scope link
       valid_lft forever preferred_lft forever
18: cali448e242b4a5@if4: <BROADCAST,MULTICAST,UP,LOWER_UP> mtu 1480 qdisc noqueue state UP group default
    link/ether ee:ee:ee:ee:ee:ee brd ff:ff:ff:ff:ff:ff link-netnsid 1
    inet6 fe80::ecee:eeff:feee:eeee/64 scope link
       valid_lft forever preferred_lft forever
23: cali566211caf94@if4: <BROADCAST,MULTICAST,UP,LOWER_UP> mtu 1480 qdisc noqueue state UP group default
    link/ether ee:ee:ee:ee:ee:ee brd ff:ff:ff:ff:ff:ff link-netnsid 2
    inet6 fe80::ecee:eeff:feee:eeee/64 scope link
       valid_lft forever preferred_lft forever
24: caliee93b0bdd66@if4: <BROADCAST,MULTICAST,UP,LOWER_UP> mtu 1480 qdisc noqueue state UP group default
    link/ether ee:ee:ee:ee:ee:ee brd ff:ff:ff:ff:ff:ff link-netnsid 3
    inet6 fe80::ecee:eeff:feee:eeee/64 scope link
       valid_lft forever preferred_lft forever
这种情况,数据包的源IP为当前节点的IP,目标IP为svc的IP。而svc对应的pod可能在当前节点,也可能在其他节点上。
比如在slave1节点上执行nc命令:nc -zv 10.150.18.86 80。即 172.16.1.50 --> 10.150.18.86
root@4906e91c-f6a7-4686-945b-535203f14695-slave-1:~# tcpdump -env -i ens3 icmp
tcpdump: listening on ens3, link-type EN10MB (Ethernet), capture size 262144 bytes
19:24:36.182734 fa:16:3e:92:11:ca > fa:16:3e:d2:26:34, ethertype IPv4 (0x0800), length 98: (tos 0x0, ttl 64, id 19048, offset 0, flags [DF], proto ICMP (1), length 84)
    172.16.1.50 > 10.150.18.86: ICMP echo request, id 4935, seq 19, length 64
用户空间的nc命令产生的数据依次经过应用层、表示层、会话层后,进入网络层,进入网络层后会查询路由表和iptables规则:
查看slave1的路由表
此处查询路由表的目的主要是判断nc工具请求的是否是本机而选择路由。此处请求的IP并不在本机网络上。
root@4906e91c-f6a7-4686-945b-535203f14695-slave-1:~# ip r get 10.150.18.86
10.150.18.86 via 172.16.0.1 dev ens3 src 172.16.1.50 uid 0    #不是local记录,说明不是本机
    cache
#补充:如果请求的是本机,规则如: local 172.16.1.50 dev lo src 172.16.1.50 uid 0

root@4906e91c-f6a7-4686-945b-535203f14695-slave-1:~# ip r
default via 172.16.0.1 dev ens3 proto dhcp src 172.16.1.50 metric 100  #匹配该条路由,说明不是请求本机
10.151.32.0/24 via 172.16.2.77 dev tunl0 proto bird onlink
10.151.49.0/24 via 172.16.1.88 dev ens3 proto bird
blackhole 10.151.51.0/24 proto bird
10.151.51.1 dev califf8f2a54a89 scope link
10.151.51.2 dev cali448e242b4a5 scope link
10.151.51.7 dev cali566211caf94 scope link
10.151.51.8 dev caliee93b0bdd66 scope link
10.151.161.0/24 via 172.16.1.221 dev ens3 proto bird
10.151.208.0/24 via 172.16.1.203 dev ens3 proto bird
169.254.169.254 via 172.16.0.1 dev ens3 proto dhcp src 172.16.1.50 metric 100
172.16.0.0/12 dev ens3 proto kernel scope link src 172.16.1.50
172.17.0.0/16 dev docker0 proto kernel scope link src 172.17.0.1 linkdown
查看OUTPUT链的nat表
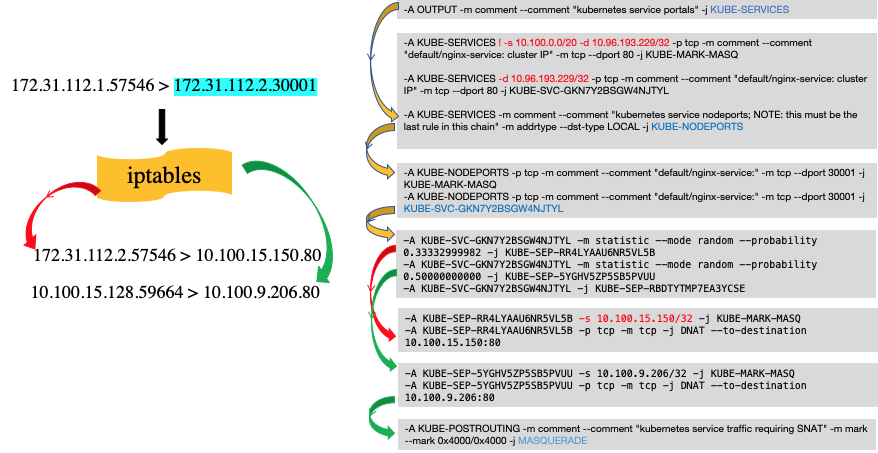
root@4906e91c-f6a7-4686-945b-535203f14695-slave-1:~# iptables -t nat -S OUTPUT
-P OUTPUT ACCEPT
-A OUTPUT -m comment --comment "cali:tVnHkvAo15HuiPy0" -j cali-OUTPUT  #未匹配到规则(自定义链cali-OUTPUT,发现未匹配到规则,分析省略)
-A OUTPUT -m comment --comment "kubernetes service portals" -j KUBE-SERVICES  #匹配

# 进入KUBE-SERVICES链
root@4906e91c-f6a7-4686-945b-535203f14695-slave-1:~# iptables -t nat -S KUBE-SERVICES |grep "default/myapp"
-N KUBE-SERVICES
-A KUBE-SERVICES ! -s 10.151.0.0/16 -d 10.150.18.86/32 -p tcp -m comment --comment "default/myapp cluster IP" -m tcp --dport 80 -j KUBE-MARK-MASQ  # 匹配到该条目:表示非pod内发出的包,匹配到。(因该条目的target为MARK操作,所以会继续匹配后续的规则)
-A KUBE-SERVICES -d 10.150.18.86/32 -p tcp -m comment --comment "default/myapp cluster IP" -m tcp --dport 80 -j KUBE-SVC-XJWXQFJLXSXKRMSG  # 匹配到该条目

root@4906e91c-f6a7-4686-945b-535203f14695-slave-1:~# iptables -t nat -S KUBE-MARK-MASQ
-N KUBE-MARK-MASQ
-A KUBE-MARK-MASQ -j MARK --set-xmark 0x4000/0x4000  #对匹配到的流量进行打标(对于符合条件的包 set mark 0x4000, 有此标记的数据包会在KUBE-POSTROUTING chain中统一做MASQUERADE),因为target为MARK,所以会对后续规则继续匹配。

# 继续匹配KUBE-SVC-XJWXQFJLXSXKRMSG自定义链
root@4906e91c-f6a7-4686-945b-535203f14695-slave-1:~# iptables -t nat -S KUBE-SVC-XJWXQFJLXSXKRMSG
-N KUBE-SVC-XJWXQFJLXSXKRMSG
-A KUBE-SVC-XJWXQFJLXSXKRMSG -m comment --comment "default/myapp" -m statistic --mode random --probability 0.33333333349 -j KUBE-SEP-OKTYPU7VJGWVVR5V
-A KUBE-SVC-XJWXQFJLXSXKRMSG -m comment --comment "default/myapp" -m statistic --mode random --probability 0.50000000000 -j KUBE-SEP-K3EELAHYPDVFVIPU
-A KUBE-SVC-XJWXQFJLXSXKRMSG -m comment --comment "default/myapp" -j KUBE-SEP-Y6Q4QAGGLGL6PUEO  #由于statistic模块会随机匹配,所以以上3个条目都可能匹配的,我们此处选择其中2条进行分析,一条表示pod在本节点,另一条表示pod在其他节点。

# 同节点的pod
root@4906e91c-f6a7-4686-945b-535203f14695-slave-1:~# iptables -t nat -S KUBE-SEP-Y6Q4QAGGLGL6PUEO
-N KUBE-SEP-Y6Q4QAGGLGL6PUEO
-A KUBE-SEP-Y6Q4QAGGLGL6PUEO -s 10.151.51.8/32 -m comment --comment "default/myapp" -j KUBE-MARK-MASQ #如果是这个pod自己访问自己
-A KUBE-SEP-Y6Q4QAGGLGL6PUEO -p tcp -m comment --comment "default/myapp" -m tcp -j DNAT --to-destination 10.151.51.8:80  #匹配,发生DNAT

#其他节点的pod
root@4906e91c-f6a7-4686-945b-535203f14695-slave-1:~# iptables -t nat -S KUBE-SEP-OKTYPU7VJGWVVR5V
-N KUBE-SEP-OKTYPU7VJGWVVR5V
-A KUBE-SEP-OKTYPU7VJGWVVR5V -s 10.151.49.8/32 -m comment --comment "default/myapp" -j KUBE-MARK-MASQ
-A KUBE-SEP-OKTYPU7VJGWVVR5V -p tcp -m comment --comment "default/myapp" -m tcp -j DNAT --to-destination 10.151.49.8:80

#至此,OUTPUT连匹配完毕
查看POSTROUTING链
OUTPUT链的匹配结束后,会继续匹配POSTROUTING链。
root@4906e91c-f6a7-4686-945b-535203f14695-slave-1:~# iptables -t nat -S POSTROUTING
-P POSTROUTING ACCEPT
-A POSTROUTING -m comment --comment "cali:O3lYWMrLQYEMJtB5" -j cali-POSTROUTING  #查看子链(过程省略),未匹配到
-A POSTROUTING -m comment --comment "kubernetes postrouting rules" -j KUBE-POSTROUTING #匹配
-A POSTROUTING -s 172.17.0.0/16 ! -o docker0 -j MASQUERADE

# 继续对第2条给进行匹配,进入KUBE-POSTROUTING链
root@4906e91c-f6a7-4686-945b-535203f14695-slave-1:~# iptables -t nat -S KUBE-POSTROUTING
-N KUBE-POSTROUTING
-A KUBE-POSTROUTING -m mark ! --mark 0x4000/0x4000 -j RETURN
-A KUBE-POSTROUTING -j MARK --set-xmark 0x4000/0x0  #匹配,并继续后面的匹配
-A KUBE-POSTROUTING -m comment --comment "kubernetes service traffic requiring SNAT" -j MASQUERADE #匹配到该条目,进行snat,将源IP替换为宿主机的IP
可以看到,在此处访问svc通过DNAT转换成访问Pod。
至此,网络层(IP层)完成,接下来会下沉到链路层,进行链路层封包。
此时,报文的IP层为
172.16.1.50 --> 10.151.51.8(本节点pod)或10.151.49.8(其他节点pod)目标IP不在本地网络(本机)中,通过查找本地路由表,匹配到路由
10.151.51.8 dev caliee93b0bdd66 scope link,发现该路由是一条2层的链路层路由(arp路由),说明目标IP与本机处于同一个二层网络中,直接可以通过arp获取到目标IP对应网卡的MAC地址。所以数据帧会从caliee93b0bdd66口(源MAC)发出,目标MAC为2e:d6:68:68:23:60,即到达Pod的eth0网卡。到达最终的目标Pod。root@4906e91c-f6a7-4686-945b-535203f14695-slave-1:~# arp -n |grep 10.151.51.8 10.151.51.8 ether 2e:d6:68:68:23:60 CM caliee93b0bdd66 #抓包 root@4906e91c-f6a7-4686-945b-535203f14695-slave-1:~# tcpdump -env -i caliee93b0bdd66 port 80 tcpdump: listening on caliee93b0bdd66, link-type EN10MB (Ethernet), capture size 262144 bytes #握手 19:41:32.472480 ee:ee:ee:ee:ee:ee > 2e:d6:68:68:23:60, ethertype IPv4 (0x0800), length 74: (tos 0x0, ttl 64, id 12738, offset 0, flags [DF], proto TCP (6), length 60) 172.16.1.50.56060 > 10.151.51.8.80: Flags [S], cksum 0xeb0f (incorrect -> 0xd179), seq 3944836934, win 64240, options [mss 1460,sackOK,TS val 4165427895 ecr 0,nop,wscale 7], length 0 19:41:32.472584 2e:d6:68:68:23:60 > ee:ee:ee:ee:ee:ee, ethertype IPv4 (0x0800), length 74: (tos 0x0, ttl 64, id 0, offset 0, flags [DF], proto TCP (6), length 60) 10.151.51.8.80 > 172.16.1.50.56060: Flags [S.], cksum 0xeb0f (incorrect -> 0x2d12), seq 2940287251, ack 3944836935, win 64260, options [mss 1440,sackOK,TS val 3616597104 ecr 4165427895,nop,wscale 7], length 0 19:41:32.472609 ee:ee:ee:ee:ee:ee > 2e:d6:68:68:23:60, ethertype IPv4 (0x0800), length 66: (tos 0x0, ttl 64, id 12739, offset 0, flags [DF], proto TCP (6), length 52) 172.16.1.50.56060 > 10.151.51.8.80: Flags [.], cksum 0xeb07 (incorrect -> 0x54d8), ack 1, win 502, options [nop,nop,TS val 4165427896 ecr 3616597104], length 0 # 挥手(由于不发数据,所以4次挥手变成3次挥手) 19:41:32.472704 ee:ee:ee:ee:ee:ee > 2e:d6:68:68:23:60, ethertype IPv4 (0x0800), length 66: (tos 0x0, ttl 64, id 12740, offset 0, flags [DF], proto TCP (6), length 52) 172.16.1.50.56060 > 10.151.51.8.80: Flags [F.], cksum 0xeb07 (incorrect -> 0x54d7), seq 1, ack 1, win 502, options [nop,nop,TS val 4165427896 ecr 3616597104], length 0 19:41:32.472893 2e:d6:68:68:23:60 > ee:ee:ee:ee:ee:ee, ethertype IPv4 (0x0800), length 66: (tos 0x0, ttl 64, id 19025, offset 0, flags [DF], proto TCP (6), length 52) 10.151.51.8.80 > 172.16.1.50.56060: Flags [F.], cksum 0xeb07 (incorrect -> 0x54d4), seq 1, ack 2, win 503, options [nop,nop,TS val 3616597105 ecr 4165427896], length 0 19:41:32.472924 ee:ee:ee:ee:ee:ee > 2e:d6:68:68:23:60, ethertype IPv4 (0x0800), length 66: (tos 0x0, ttl 64, id 12741, offset 0, flags [DF], proto TCP (6), length 52) 172.16.1.50.56060 > 10.151.51.8.80: Flags [.], cksum 0xeb07 (incorrect -> 0x54d5), ack 2, win 502, options [nop,nop,TS val 4165427896 ecr 3616597105], length 0如果目标IP为10.151.49.8,目标IP不在本地网络中,通过查找本地路由表,匹配到路由
10.151.49.0/24 via 172.16.1.88 dev ens3 proto bird,数据包需要先通过ens3发送到下一跳172.16.1.88,所以帧的MAC为本机ens3的MAC地址,目标MAC为下一跳的MAC地址。root@4906e91c-f6a7-4686-945b-535203f14695-slave-1:~# tcpdump -env -i ens3 port 80 tcpdump: listening on ens3, link-type EN10MB (Ethernet), capture size 262144 bytes #握手 19:39:12.485915 fa:16:3e:92:11:ca > fa:16:3e:a9:16:9f, ethertype IPv4 (0x0800), length 74: (tos 0x0, ttl 64, id 24420, offset 0, flags [DF], proto TCP (6), length 60) 172.16.1.50.55972 > 10.151.49.8.80: Flags [S], cksum 0xe90f (incorrect -> 0x30c0), seq 3418510475, win 64240, options [mss 1460,sackOK,TS val 4165287909 ecr 0,nop,wscale 7], length 0 19:39:12.486750 fa:16:3e:a9:16:9f > fa:16:3e:92:11:ca, ethertype IPv4 (0x0800), length 74: (tos 0x0, ttl 63, id 0, offset 0, flags [DF], proto TCP (6), length 60) 10.151.49.8.80 > 172.16.1.50.55972: Flags [S.], cksum 0xeea3 (correct), seq 1123531887, ack 3418510476, win 64260, options [mss 1440,sackOK,TS val 2103428420 ecr 4165287909,nop,wscale 7], length 0 19:39:12.486807 fa:16:3e:92:11:ca > fa:16:3e:a9:16:9f, ethertype IPv4 (0x0800), length 66: (tos 0x0, ttl 64, id 24421, offset 0, flags [DF], proto TCP (6), length 52) 172.16.1.50.55972 > 10.151.49.8.80: Flags [.], cksum 0xe907 (incorrect -> 0x166a), ack 1, win 502, options [nop,nop,TS val 4165287910 ecr 2103428420], length 0 # 挥手 19:39:12.486904 fa:16:3e:92:11:ca > fa:16:3e:a9:16:9f, ethertype IPv4 (0x0800), length 66: (tos 0x0, ttl 64, id 24422, offset 0, flags [DF], proto TCP (6), length 52) 172.16.1.50.55972 > 10.151.49.8.80: Flags [F.], cksum 0xe907 (incorrect -> 0x1669), seq 1, ack 1, win 502, options [nop,nop,TS val 4165287910 ecr 2103428420], length 0 19:39:12.487449 fa:16:3e:a9:16:9f > fa:16:3e:92:11:ca, ethertype IPv4 (0x0800), length 66: (tos 0x0, ttl 63, id 55352, offset 0, flags [DF], proto TCP (6), length 52) 10.151.49.8.80 > 172.16.1.50.55972: Flags [F.], cksum 0x1666 (correct), seq 1, ack 2, win 503, options [nop,nop,TS val 2103428421 ecr 4165287910], length 0 19:39:12.487498 fa:16:3e:92:11:ca > fa:16:3e:a9:16:9f, ethertype IPv4 (0x0800), length 66: (tos 0x0, ttl 64, id 24423, offset 0, flags [DF], proto TCP (6), length 52) 172.16.1.50.55972 > 10.151.49.8.80: Flags [.], cksum 0xe907 (incorrect -> 0x1667), ack 2, win 502, options [nop,nop,TS val 4165287910 ecr 2103428421], length 0后续步骤就与Pod网络访问类似,不再赘述。
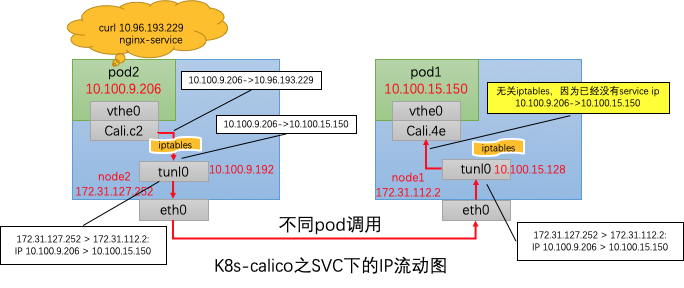

同node内调用,并没有调用tunl0进行IPIP封装,直接由Cali.c2转发到了Cali.fa,中间经过了DNAT转换和ip route路由,与此前并没有啥不同,不再赘述。
与同node内调用相比,可以发现,发送请求在经过iptables后,不仅仅进行了DNAT,也进行了SNAT,其src host 由Pod2的ip 10.100.9.206转为了node2的主机ip 172.31.127.252。同Pod会额外进行SNAT的转换哦。
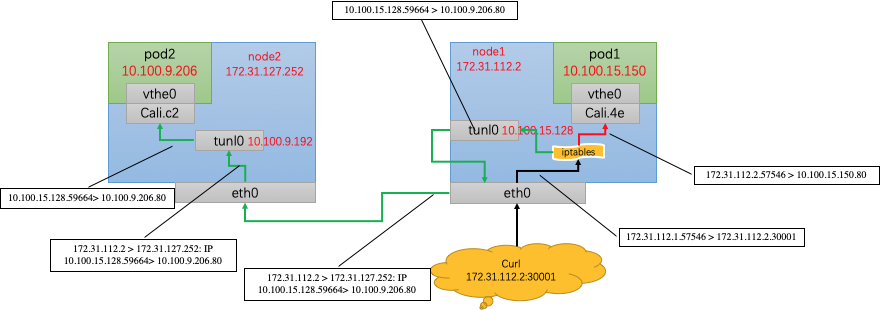
总结如下:
不管从哪个node进入,kube-proxy机制仍会随机将请求转发到某一个Pod中,与node无关。
访问同node中的Pod,会进行DNAT,将service ip转化为podip。
访问异node中的Pod,除了进行DNAT,也会进行SNAT,从Pod中看到的src ip为转发该ip报的node中的tunl0的ip地址。
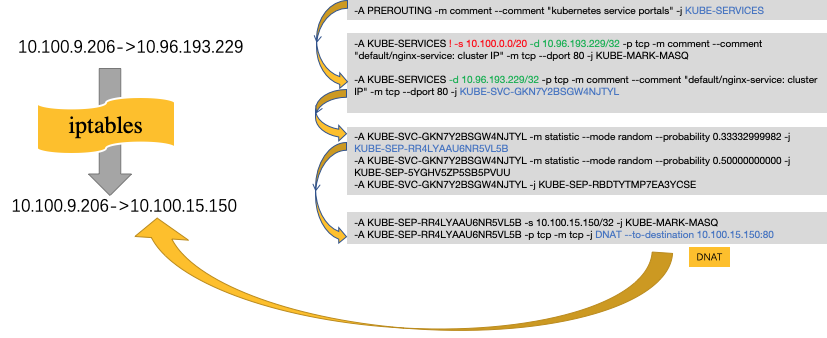
- 所有的service调用都会进行DNAT转换,在当前节点上,将service ip转换为将要调用的Pod ip
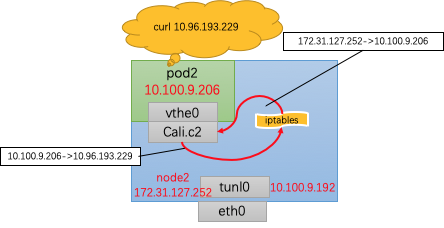
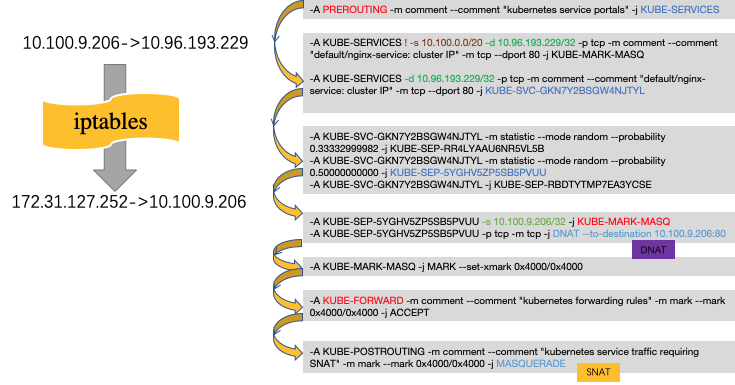
- 对于同Pod内调用,为了防止出现“自己调自己”的情况,需要进行SNAT,将src ip转换为node ip
- 对于集群外访问,如果访问的node地址不是Pod所在的地址,那么会进行一次SNAT,将src ip转换为node内的tunl0 ip。
- kube-proxy只修改了filter和nat表,它对iptables的链进行了扩充,自定义了KUBE-SERVICES,KUBE-NODEPORTS,KUBE-POSTROUTING,KUBE-MARK-MASQ和KUBE-MARK-DROP五个链,并主要通过为 KUBE-SERVICES链(附着在PREROUTING和OUTPUT)增加rule来配制traffic routing 规则。