005 Prometheus配置文件详解
Prometheus是微服务架构,prometheus server通过配置文件与其他组件进行关联。
https://prometheus.io/docs/prometheus/latest/configuration/configuration/#relabel_config
global:
  # How frequently to scrape targets by default.
  [ scrape_interval: <duration> | default = 1m ]

  # How long until a scrape request times out.
  [ scrape_timeout: <duration> | default = 10s ]

  # How frequently to evaluate rules.
  [ evaluation_interval: <duration> | default = 1m ]

  # The labels to add to any time series or alerts when communicating with
  # external systems (federation, remote storage, Alertmanager).
  external_labels:
    [ <labelname>: <labelvalue> ... ]

  # File to which PromQL queries are logged.
  # Reloading the configuration will reopen the file.
  [ query_log_file: <string> ]

# Rule files specifies a list of globs. Rules and alerts are read from
# all matching files.
rule_files:
  [ - <filepath_glob> ... ]

# A list of scrape configurations.
scrape_configs:
  [ - <scrape_config> ... ]

# Alerting specifies settings related to the Alertmanager.
alerting:
  alert_relabel_configs:
    [ - <relabel_config> ... ]
  alertmanagers:
    [ - <alertmanager_config> ... ]

# Settings related to the remote write feature.
remote_write:
  [ - <remote_write> ... ]

# Settings related to the remote read feature.
remote_read:
  [ - <remote_read> ... ]
示例:
# my global config
global:
  scrape_interval:     15s # 抓取metrics的时间间隔. Default is every 1 minute.
  evaluation_interval: 15s # 评估rules的时间间隔. The default is every 1 minute.
  scrape_timeout: 5s  #抓取metric的超时时间。 default (10s).

# Alertmanager configuration(配置如何连接alertmanager,进行推送告警,可以使用静态配置,也可以使用动态发现的方式)
alerting:
  alertmanagers:
  - static_configs:
    - targets:
      # - alertmanager_ip:9093
  # 文件发现的方式
  #- file_sd_configs:
  #  - files:
  #    - "targets/alertmanager-*.yaml"

# 加载rules并周期性评估,可以使用相对路径。rule分为:记录规则和告警规则
rule_files:
  # - "first_rules.yml"
  # - "second_rules.yml"

# A scrape configuration containing exactly one endpoint to scrape:
# Here it's Prometheus itself.
scrape_configs:
  - job_name: 'prometheus'   ###这个必须配置,这个地址抓取的所有数据会自动加上`job=prometheus`的标签
    # metrics_path defaults to '/metrics'   #抓取监控目标的路径,默认是`/metrics`,可以根据自己业务的需要进行修改
    # scheme defaults to 'http'.
    static_configs:  #这是通过静态文件的配置方法:这种方法直接指定要抓去目标的ip和端口
    - targets: ['localhost:9090']  #抓取的所有数据会自动加上`instance=${TARGET}`的标签
  - job_name: 'node'
    static_configs:
    - targets: ['192.168.5.10:9100','192.168.5.11:9100','192.168.5.12:9100']
      lables:
        app: node
    params:
      collect[]:
        - cpu
        - meminfo
        - diskstats
        - netdev
        - netstat
        - filefd
        - filesystem
        - xfs
        - systemd

  - job_name: 'docker'
    static_configs:
    - targets: ['192.168.5.10:8080','192.168.5.11:8080','192.168.5.12:8080']
    metric_relabel_configs:
      # 删除label
      - source_labels: '[__name__]'  #逗号分隔多个
        separator: ','  # 默认为分号
        regex: '(container_tasks_state|container_memory_failures_total)'
        action: drop #默认值为replace
      # 替换标签
      - source_labels: [id]
        target_label: container_id
        regex: '/kubepods/([a-z0-9]+)'
        replacement: '$1'
        action: replace
      # 删除标签
      - regex: 'kernelVersion'
        action: labeldrop
可以发现,Prometheus的配置文件中,常用的模块主要有:global(全局配置)、alerting(告警配置)、rule_files(规则配置)、scrape_configs(抓取配置),接下来我们主要介绍规则和抓取这两个经常需要配置的模块,而全局配置和告警配置较为固定,一般不会经常地修改。
Prometheus支持两种类型的规则:记录规则(record)和警报规则(alert),可以对其进行配置,然后定期进行评估。记录和警报规则存在于规则组中。组中的规则以指定的时间间隔顺序运行。
记录规则使您可以预先计算经常需要计算或计算量大的表达式,并将其结果保存为一组新的时间序列,减小prometheus实时计算的压力(例如仪表板查询的数据)。
在Prometheus的表达式浏览器进行的查询会生成的新的数据序列,但其结果仅会临时保存于Prometheus Server上;在样本数据量较大、工作较为繁忙的Prometheus Server上,对于那些查询频率较高且运算较为复杂的查询来说,实时查询可能会存在一定程度的响应延迟;记录规则(Recording rule)能够预先运行频繁使用到或计算消耗较大的表达式,并将其结果保存为一组新的时间序列减小prometheus实时计算的压力(例如仪表板查询的数据);
记录规则是定义在Prometheus配置文件中的查询语句,由Server加载后,它能够于以类似批处理任务的方式在后台周期性的执行并记录查询结果;客户端只需要查询由记录规则生成的结果时间序列上的样本数据即可,速度远快于实时查询;常用于跨多个时间序列生成聚合数据,或者计算消耗较大的查询等场景中;多见于同可视化工具结合使用的需求中,也可用于生成可产生告警信息的时间序列;
告警规则(Alert rule)是另一种定义在Prometheus配置文件中的PromQL表达式,它通常是一个基于查询语句的布尔表达式,该表达式负责触发告警;告警规则中用的查询语句较为复杂时,可将其保存为记录规则,而后通过查询该记录规则生成的时间序列来参与比较,从而避免实时查询导致的较长时间延迟;
记录规则将生成新的时间序列,因而其名称必须是规范的指标名称格式;
记录规则必须定义在规则组(rule group)中,各规则按给定的顺序依次运行;
groups:
  - name: example
    interval: 5s
    rules:
    - record: job:http_inprogress_requests:sum  # 表示record规则
      expr: sum by (job) (http_inprogress_requests)
      labels:
  		  [ <labelname>: <labelvalue> ]
模板示例:
groups:
- name: node-exporter.rules
  rules:
  - expr: count without (cpu) (count without (mode) (node_cpu_seconds_total{job="node-exporter"}))
    record: instance:node_num_cpu:sum
  - expr: 1 - avg without (cpu, mode) (rate(node_cpu_seconds_total{job="node-exporter", mode="idle"}[1m]))
    record: instance:node_cpu_utilisation:rate1m
  - expr: (node_load1{job="node-exporter"}/instance:node_num_cpu:sum{job="node-exporter"})
    record: instance:node_load1_per_cpu:ratio
  - expr: 1 - (node_memory_MemAvailable_bytes{job="node-exporter"}/node_memory_MemTotal_bytes{job="node-exporter"})
    record: instance:node_memory_utilisation:ratio
groups:
- name: example
  rules:
  - alert: HighRequestLatency  # 表示alert规则
    expr: job:request_latency_seconds:mean5m{job="myjob"} > 0.5
    for: 10m
    labels:
      severity: page
    annotations:
      summary: High request latency
for:表示触发条件后(进入pending状态),持续for时间后如果仍然触发,则会将pending转化为firing状态,处于firing状态后,会发送告警通知。
labels、annotations为告警添加标签和注解信息。可是使用模板。
$labels:alert实例持有的标签。$externalLabels:alert实例外部的标签。$value:alert实例评估值
模板示例:
groups:
- name: 主机状态
  rules:

  # Alert for any instance that is unreachable for >5 minutes.
  - alert: InstanceDown
    expr: up == 0
    for: 5m
    labels:
      severity: page
    annotations:
      summary: "Instance {{ $labels.instance }} down"
      description: "{{ $labels.instance }} of job {{ $labels.job }} has been down for more than 5 minutes."

  # Alert for any instance that has a median request latency >1s.
  - alert: APIHighRequestLatency
    expr: api_http_request_latencies_second{quantile="0.5"} > 1
    for: 10m
    annotations:
      summary: "High request latency on {{ $labels.instance }}"
      description: "{{ $labels.instance }} has a median request latency above 1s (current value: {{ $value }}s)"
记录规则和告警规则,通常要保存于单独的文件中,如rules/recording_rules.yaml,而后在prometheus.yml中通过rule_files加载该文件:
rule_files:
  - rules/recording_rules.yaml  #可以使用通配符
  # - "second_rules.yml"
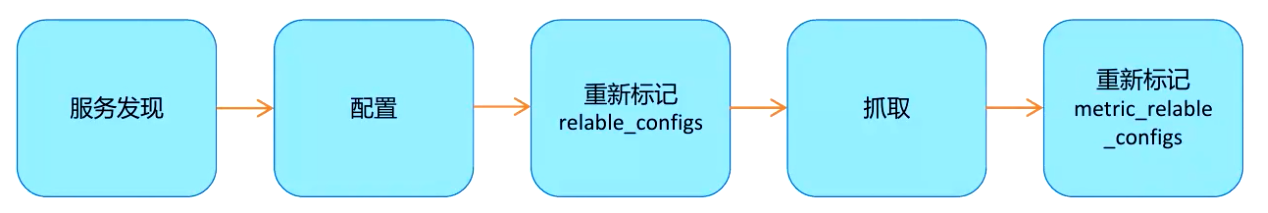
服务发现(形成target列表) -> 配置(抓取间隔等等) -> (target)relabel -> 指标数据抓取 -> metrics relabel -> 存储时间序列

上图展示了Prometheus上进行指标抓取的简单生命周期
- 在每个scrape_interval期间,Prometheus都会检查执行的作业(Job);这些作业首先会根据Job上指定的发现配置生成target列表,此即服务发现过程;
- 服务发现会返回一个Target列表,其中包含一组称为元数据的标签,这些标签都以
_meta_为前缀; - 服务发现还会根据target配置来设置其它标签,这些标签带有
__前缀和后缀,其中如下4个元数据标签主要用来定义向哪个地址发送抓取请求:__scheme__:target支持使用的协议(http或https,默认为http)__address__:target的地址(IP:PORT)__metric_path__:指标的URI路径(默认为/metrics)__param_<name>:若URI路径中存在任何参数(/metrics?name=value),则它们的前缀会设置为__param_<name>
- 这些目标列表和标签会返回给Prometheus,其中的一些标签也可以在配置中被覆盖;
- 元数据标签会在抓取的生命周期中被重复利用以生成其他标签,例如,指标上的instance标签的默认值就来自于
__address__标签的值;
- 服务发现会返回一个Target列表,其中包含一组称为元数据的标签,这些标签都以
- 配置:配置如何抓取指标,比如抓取周期等
- 对于发现的各target,Prometheus提供了可以重新标记(relabel)目标的机会
- 它定义在job配置段的
relabel_configs配置中,常用于实现如下功能- 将来自服务发现的元数据标签中的信息附加到指标的标签上;
- 过滤目标;
- 它定义在job配置段的
- 这之后,便是数据抓取、以及指标返回的过程;
- 抓取而来的指标在保存之前,还允许用户对指标进行重新打标并过滤;
- 它定义在job配置段的
metric_relabel_configs配置中,常用于实现如下功能- 删除不必要的指标;
- 从指标中删除敏感或不需要的标签;
- 添加、编辑或修改指标的标签值或标签格式;
- 它定义在job配置段的
服务发现后,形成了一个target列表,Prometheus会向target进行metric抓取,抓取的地址(Endpoint)为:
${__scheme__}://${__address__}/${__metrics_path__:-metrics}?${__param_<name>}=xxx&...。如果要修改Prometheus的抓取地址,需要在抓取之前,修改以上标签的值,从而实现抓取目标的自定义。
抓取配置(scrape_config)
推荐文档:https://cloud.tencent.com/document/product/248/53288
# The job name assigned to scraped metrics by default.
# 抓取任务名称,同时会在对应抓取的指标中加了一个 label(job=job_name)
job_name: <job_name>

# How frequently to scrape targets from this job.
# 抓取任务时间间隔
[ scrape_interval: <duration> | default = <global_config.scrape_interval> ]

# Per-scrape timeout when scraping this job.
# 抓取请求超时时间
[ scrape_timeout: <duration> | default = <global_config.scrape_timeout> ]

# The HTTP resource path on which to fetch metrics from targets.
# 抓取任务请求 URI 路径
[ metrics_path: <path> | default = /metrics ]

# Optional HTTP URL parameters.
params:
  [ <string>: [<string>, ...] ]

# List of labeled statically configured targets for this job.
static_configs:
  [ - <static_config> ... ]

# List of file service discovery configurations.
file_sd_configs:
  [ - <file_sd_config> ... ]

# List of Kubernetes service discovery configurations.
kubernetes_sd_configs:
  [ - <kubernetes_sd_config> ... ]

# List of target relabel configurations.
relabel_configs:
  [ - <relabel_config> ... ]

# List of metric relabel configurations.
metric_relabel_configs:
  [ - <relabel_config> ... ]
1、静态配置(static_configs)
# The targets specified by the static config.
targets:
  [ - '<host>' ]

# Labels assigned to all metrics scraped from the targets. 给抓取的metric进行打标签
labels:
  [ <labelname>: <labelvalue> ... ]
示例:
scrape_configs:
  - job_name: 'prometheus'
    static_configs:
    - targets: ['localhost:9090']

  - job_name: 'node'
    static_configs:
    - targets: ['192.168.5.10:9100','192.168.5.11:9100','192.168.5.12:9100']
    params:
      collect[]:
        - cpu
        - meminfo
        - diskstats
        - netdev
        - netstat
        - filefd
        - filesystem
        - xfs
        - systemd

  - job_name: 'docker'
    static_configs:
    - targets:
      - '192.168.5.10:8080'
      - '192.168.5.11:8080'
      - '192.168.5.12:8080'
    labels:
    - paltform: docker
- job_name: sub-cluster-jituan
  honor_labels: true
  metrics_path: /federate
  scrape_interval: 1m
  scrape_timeout: 1m
  basic_auth:
    username: admin
    password: QY62wJ
  params:
    match[]:
    - '{job="service"}'
  static_configs:
  - targets:
    - 10.58.240.37:9090
Prometheus为何要进行服务发现?
Prometheus Server的数据抓取工作于Pull模型,因而,它必需要事先知道各Target的位置,然后才能从相应的Exporter或Instrumentation中抓取数据。
对于小型的系统环境来说,通过static_configs指定各Target便能解决问题,这也是最简单的配置方法;每个Targets用一个网络端点(ip:port)进行标识;
对于中大型的系统环境或具有较强动态性的云计算环境来说,静态配置显然难以适用;因此,Prometheus为此专门设计了一组服务发现机制,以便于能够基于服务注册中心(服务总线)自动发现、检测、分类可被监控的各Target,以及更新发生了变动的Target;
基于文件( file_sd):
基于文件的服务发现是仅仅略优于静态配置的服务发现方式,它不依赖于任何平台或第三方服务,因而也是最为简单和通用的实现方式;
Prometheus Server定期从文件中加载Target信息。文件可使用JSON和YAML格式,它含有定义的Target列表,以及可选的标签信息;
Prometheus主配置文件:发现target的配置,定义在配置文件的job之中:
# my global config
# Author: MageEdu <mage@magedu.com>
# Repo: http://gitlab.magedu.com/MageEdu/prometheus-configs/
global:
  scrape_interval:     15s # Set the scrape interval to every 15 seconds. Default is every 1 minute.
  evaluation_interval: 15s # Evaluate rules every 15 seconds. The default is every 1 minute.
  # scrape_timeout is set to the global default (10s).

# Alertmanager configuration
alerting:
  alertmanagers:
  - static_configs:
    - targets:
      # - alertmanager:9093

# Load rules once and periodically evaluate them according to the global 'evaluation_interval'.
rule_files:
  # - "first_rules.yml"
  # - "second_rules.yml"

# A scrape configuration containing exactly one endpoint to scrape:
# Here it's Prometheus itself.
scrape_configs:
  # The job name is added as a label `job=<job_name>` to any timeseries scraped from this config.
  - job_name: 'prometheus'

    # metrics_path defaults to '/metrics'
    # scheme defaults to 'http'.

    # 基于文件的服务发现
    file_sd_configs:
    - files:                         # 指定要加载的文件列表
      - targets/prometheus-*.yaml    # 文件加载支持glob通配符
      refresh_interval: 2m           # 每隔2min重新加载一次文件中定义的target,默认为5min

  # All nodes
  - job_name: 'nodes'
    file_sd_configs:
    - files:
      - targets/nodes-*.yaml
      refresh_interval: 2m
yaml格式:
# targets/prometheus-servers.yaml
- targets:
  - 192.168.1.11:9090
  - 192.168.1.12:9090
  labels:
    app: prometheus
    component: prometheus
#- targets:
#....
json格式:
[
  {
    "targets": [ "192.168.1.11:9090","192.168.1.12:9090" ],
    "labels": {
      "app": "prometheus",
      "component": "prometheus"
    }
  },
  ...
]
这些文件可由另一个系统生成,例如Puppet、Ansible或Saltstack等配置管理系统,也可能是由脚本基于CMDB(配置管理数据库)定期查询生成;
基于DNS(dns_sd_config):
基于DNS的服务发现针对一组DNS域名进行定期查询,以发现待监控的目标
- Prometheus查询时使用的DNS服务器由/etc/resolv.conf文件指定;
- 该DNS发现机制依赖于A、AAAA和SRV资源记录,且仅支持该类方法,尚不支持RFC6763中的高级DNS发现方式;
# A list of DNS domain names to be queried.  此处要指定SRV资源记录的名称(SRV解析端口号),例如'_prometheus._tcp.ljzsdut.com'
names:
  [ - <domain_name> ]

# The type of DNS query to perform.  取值:SRV, A, AAAA.
[ type: <query_type> | default = 'SRV' ]

# The port number used if the query type is not SRV.
[ port: <number>]

# The time after which the provided names are refreshed.
[ refresh_interval: <duration> | default = 30s ]
示例:
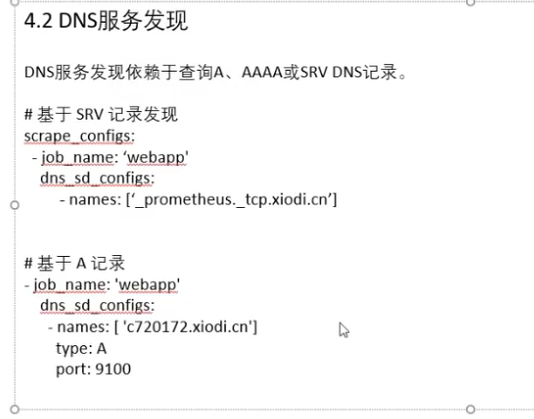
示例:
相应的元数据标签:
- __meta dns_name
- __meta_dns_srv_record_target
- __meta_dns_srv_record_port
例如Kubernetes、Consul、Azure、……都是基于API的服务发现。
基于Kuberpetes API的服务发现机制中,支持将API Server中Node、Service、Endpoint、Pod和Ingress等资源类型下相应的各资源对象视作target,并持续监视相关资源的变动;
- Node、Service、Endpoint、Pod和Ingress资源分别由各自的发现机制进行定义,负责发现每种类型资源对象的组件,在Prometheus中称为一个“role"。
- 同时支持在集群上基于DaemonSet控制器部署node-exporter后发现各节点
参考文档:https://prometheus.io/docs/prometheus/latest/configuration/configuration/#kubernetes_sd_config
Prometheus的node role将Kubernetes集群中的每个节点视作一个target,这些节点都监听着kubelet使用的端口;
node role依次检索节点规范(.spec)上的NodeInternalIP、NodeExternalIP、NodeLegacyHostIP和NodeHostName字段,并将发现的第一个地址作为目标地址(__address__);
节点上instance标签的值取自从API Server中发现的节点的名称;
Prometheus的pod role负责发现Kubernetes集群上的每个Pod资源并暴露其容器为target;
- 把Pod上ports字段声明的每个端口视作一个target;
- 会为未指定端口的容器创建“无端口”类型的target,以便于用户通过relabel机制手动添加端口
Prometheus的service role负责发现Kubernetes集群上的每个Service资源;
- 把Service上声明的每个端口视作一个target;
- 特别适用于对Service进行黑盒监控的场景;
- target地址为Service的DNS名称及相应的端口;
Prometheus的endpoint tole从各Endpoint资源中发现目标;
- 它把endpoint上的每个端口都视作一个单独的target;
- 若endpoint的后端工作负载是Pod,则会把该Pod上其它未绑定到endpoint的端口同样视作个单独的目标;
- 若发现的Endpoint资源属于某个Service,则相关Service的元标签也会添加在该Endpoint上;
- 若发现的Endpoint资源的后端端点是Pod,则相关Pod的元标签也会添加在该Endpoint上;
Prometheus的ingress role负责从API Server中发现Ingress资源;
- 它把Ingress资源上的每个path视作一个target;
- 特别适用于对Ingress进行黑盒监控的场景;
- 相关的地址被设定为Ingress资源上相关host字段的值;
示例
---
kind: ConfigMap
apiVersion: v1
metadata:
  labels:
    app: prometheus
  name: prometheus-config
  namespace: prom
data:
  prometheus.yml: |
    # A scrape configuration for running Prometheus on a Kubernetes cluster.
    # This uses separate scrape configs for cluster components (i.e. API server, node)
    # and services to allow each to use different authentication configs.
    #
    # Kubernetes labels will be added as Prometheus labels on metrics via the
    # `labelmap` relabeling action.
    #
    # If you are using Kubernetes 1.7.2 or earlier, please take note of the comments
    # for the kubernetes-cadvisor job; you will need to edit or remove this job.
    # Scrape config for API servers.
    #
    # Kubernetes exposes API servers as endpoints to the default/kubernetes
    # service so this uses `endpoints` role and uses relabelling to only keep
    # the endpoints associated with the default/kubernetes service using the
    # default named port `https`. This works for single API server deployments as
    # well as HA API server deployments.
    global:
      scrape_interval: 15s
      scrape_timeout: 10s
      evaluation_interval: 1m
    scrape_configs:
    - job_name: 'kubernetes-apiservers'
      kubernetes_sd_configs:
      - role: endpoints
      # Default to scraping over https. If required, just disable this or change to
      # `http`.
      scheme: https
      # This TLS & bearer token file config is used to connect to the actual scrape
      # endpoints for cluster components. This is separate to discovery auth
      # configuration because discovery & scraping are two separate concerns in
      # Prometheus. The discovery auth config is automatic if Prometheus runs inside
      # the cluster. Otherwise, more config options have to be provided within the
      # <kubernetes_sd_config>.
      tls_config:
        ca_file: /var/run/secrets/kubernetes.io/serviceaccount/ca.crt
        # If your node certificates are self-signed or use a different CA to the
        # master CA, then disable certificate verification below. Note that
        # certificate verification is an integral part of a secure infrastructure
        # so this should only be disabled in a controlled environment. You can
        # disable certificate verification by uncommenting the line below.
        #
        # insecure_skip_verify: true
      bearer_token_file: /var/run/secrets/kubernetes.io/serviceaccount/token
      # Keep only the default/kubernetes service endpoints for the https port. This
      # will add targets for each API server which Kubernetes adds an endpoint to
      # the default/kubernetes service.
      relabel_configs:
      - source_labels: [__meta_kubernetes_namespace, __meta_kubernetes_service_name, __meta_kubernetes_endpoint_port_name]
        action: keep
        regex: default;kubernetes;https
    # Scrape config for nodes (kubelet).
    #
    # Rather than connecting directly to the node, the scrape is proxied though the
    # Kubernetes apiserver.  This means it will work if Prometheus is running out of
    # cluster, or can't connect to nodes for some other reason (e.g. because of
    # firewalling).
    - job_name: 'kubernetes-nodes'
      # Default to scraping over https. If required, just disable this or change to
      # `http`.
      scheme: https
      # This TLS & bearer token file config is used to connect to the actual scrape
      # endpoints for cluster components. This is separate to discovery auth
      # configuration because discovery & scraping are two separate concerns in
      # Prometheus. The discovery auth config is automatic if Prometheus runs inside
      # the cluster. Otherwise, more config options have to be provided within the
      # <kubernetes_sd_config>.
      tls_config:
        ca_file: /var/run/secrets/kubernetes.io/serviceaccount/ca.crt
      bearer_token_file: /var/run/secrets/kubernetes.io/serviceaccount/token
      kubernetes_sd_configs:
      - role: node
      relabel_configs:
      - action: labelmap
        regex: __meta_kubernetes_node_label_(.+)
      - target_label: __address__
        replacement: kubernetes.default.svc:443
      - source_labels: [__meta_kubernetes_node_name]
        regex: (.+)
        target_label: __metrics_path__
        replacement: /api/v1/nodes/${1}/proxy/metrics
    # Scrape config for Kubelet cAdvisor.
    #
    # This is required for Kubernetes 1.7.3 and later, where cAdvisor metrics
    # (those whose names begin with 'container_') have been removed from the
    # Kubelet metrics endpoint.  This job scrapes the cAdvisor endpoint to
    # retrieve those metrics.
    #
    # In Kubernetes 1.7.0-1.7.2, these metrics are only exposed on the cAdvisor
    # HTTP endpoint; use "replacement: /api/v1/nodes/${1}:4194/proxy/metrics"
    # in that case (and ensure cAdvisor's HTTP server hasn't been disabled with
    # the --cadvisor-port=0 Kubelet flag).
    #
    # This job is not necessary and should be removed in Kubernetes 1.6 and
    # earlier versions, or it will cause the metrics to be scraped twice.
    - job_name: 'kubernetes-cadvisor'
      # Default to scraping over https. If required, just disable this or change to
      # `http`.
      scheme: https
      # This TLS & bearer token file config is used to connect to the actual scrape
      # endpoints for cluster components. This is separate to discovery auth
      # configuration because discovery & scraping are two separate concerns in
      # Prometheus. The discovery auth config is automatic if Prometheus runs inside
      # the cluster. Otherwise, more config options have to be provided within the
      # <kubernetes_sd_config>.
      tls_config:
        ca_file: /var/run/secrets/kubernetes.io/serviceaccount/ca.crt
      bearer_token_file: /var/run/secrets/kubernetes.io/serviceaccount/token
      kubernetes_sd_configs:
      - role: node
      relabel_configs:
      - action: labelmap
        regex: __meta_kubernetes_node_label_(.+)
      - target_label: __address__
        replacement: kubernetes.default.svc:443
      - source_labels: [__meta_kubernetes_node_name]
        regex: (.+)
        target_label: __metrics_path__
        replacement: /api/v1/nodes/${1}/proxy/metrics/cadvisor
    # Scrape config for service endpoints.
    #
    # The relabeling allows the actual service scrape endpoint to be configured
    # via the following annotations:
    #
    # * `prometheus.io/scrape`: Only scrape services that have a value of `true`
    # * `prometheus.io/scheme`: If the metrics endpoint is secured then you will need
    # to set this to `https` & most likely set the `tls_config` of the scrape config.
    # * `prometheus.io/path`: If the metrics path is not `/metrics` override this.
    # * `prometheus.io/port`: If the metrics are exposed on a different port to the
    # service then set this appropriately.
    - job_name: 'kubernetes-service-endpoints'
      kubernetes_sd_configs:
      - role: endpoints
      relabel_configs:
      - source_labels: [__meta_kubernetes_service_annotation_prometheus_io_scrape]
        action: keep
        regex: true
      - source_labels: [__meta_kubernetes_service_annotation_prometheus_io_scheme]
        action: replace
        target_label: __scheme__
        regex: (https?)
      - source_labels: [__meta_kubernetes_service_annotation_prometheus_io_path]
        action: replace
        target_label: __metrics_path__
        regex: (.+)
      - source_labels: [__address__, __meta_kubernetes_service_annotation_prometheus_io_port]
        action: replace
        target_label: __address__
        regex: ([^:]+)(?::\d+)?;(\d+)
        replacement: $1:$2
      - action: labelmap
        regex: __meta_kubernetes_service_label_(.+)
      - source_labels: [__meta_kubernetes_namespace]
        action: replace
        target_label: kubernetes_namespace
      - source_labels: [__meta_kubernetes_service_name]
        action: replace
        target_label: kubernetes_name
    # Example scrape config for pods
    #
    # The relabeling allows the actual pod scrape endpoint to be configured via the
    # following annotations:
    #
    # * `prometheus.io/scrape`: Only scrape pods that have a value of `true`
    # * `prometheus.io/path`: If the metrics path is not `/metrics` override this.
    # * `prometheus.io/port`: Scrape the pod on the indicated port instead of the
    # pod's declared ports (default is a port-free target if none are declared).
    - job_name: 'kubernetes-pods'
      # if you want to use metrics on jobs, set the below field to
      # true to prevent Prometheus from setting the `job` label
      # automatically.
      honor_labels: false
      kubernetes_sd_configs:
      - role: pod
      # skip verification so you can do HTTPS to pods
      tls_config:
        insecure_skip_verify: true
      # make sure your labels are in order
      relabel_configs:
      # these labels tell Prometheus to automatically attach source
      # pod and namespace information to each collected sample, so
      # that they'll be exposed in the custom metrics API automatically.
      - source_labels: [__meta_kubernetes_namespace]
        action: replace
        target_label: namespace
      - source_labels: [__meta_kubernetes_pod_name]
        action: replace
        target_label: pod
      # these labels tell Prometheus to look for
      # prometheus.io/{scrape,path,port} annotations to configure
      # how to scrape
      - source_labels: [__meta_kubernetes_pod_annotation_prometheus_io_scrape]
        action: keep
        regex: true
      - source_labels: [__meta_kubernetes_pod_annotation_prometheus_io_path]
        action: replace
        target_label: __metrics_path__
        regex: (.+)
      - source_labels: [__address__, __meta_kubernetes_pod_annotation_prometheus_io_port]
        action: replace
        regex: ([^:]+)(?::\d+)?;(\d+)
        replacement: $1:$2
        target_label: __address__
      - source_labels: [__meta_kubernetes_pod_annotation_prometheus_io_scheme]
        action: replace
        target_label: __scheme__
        regex: (.+)
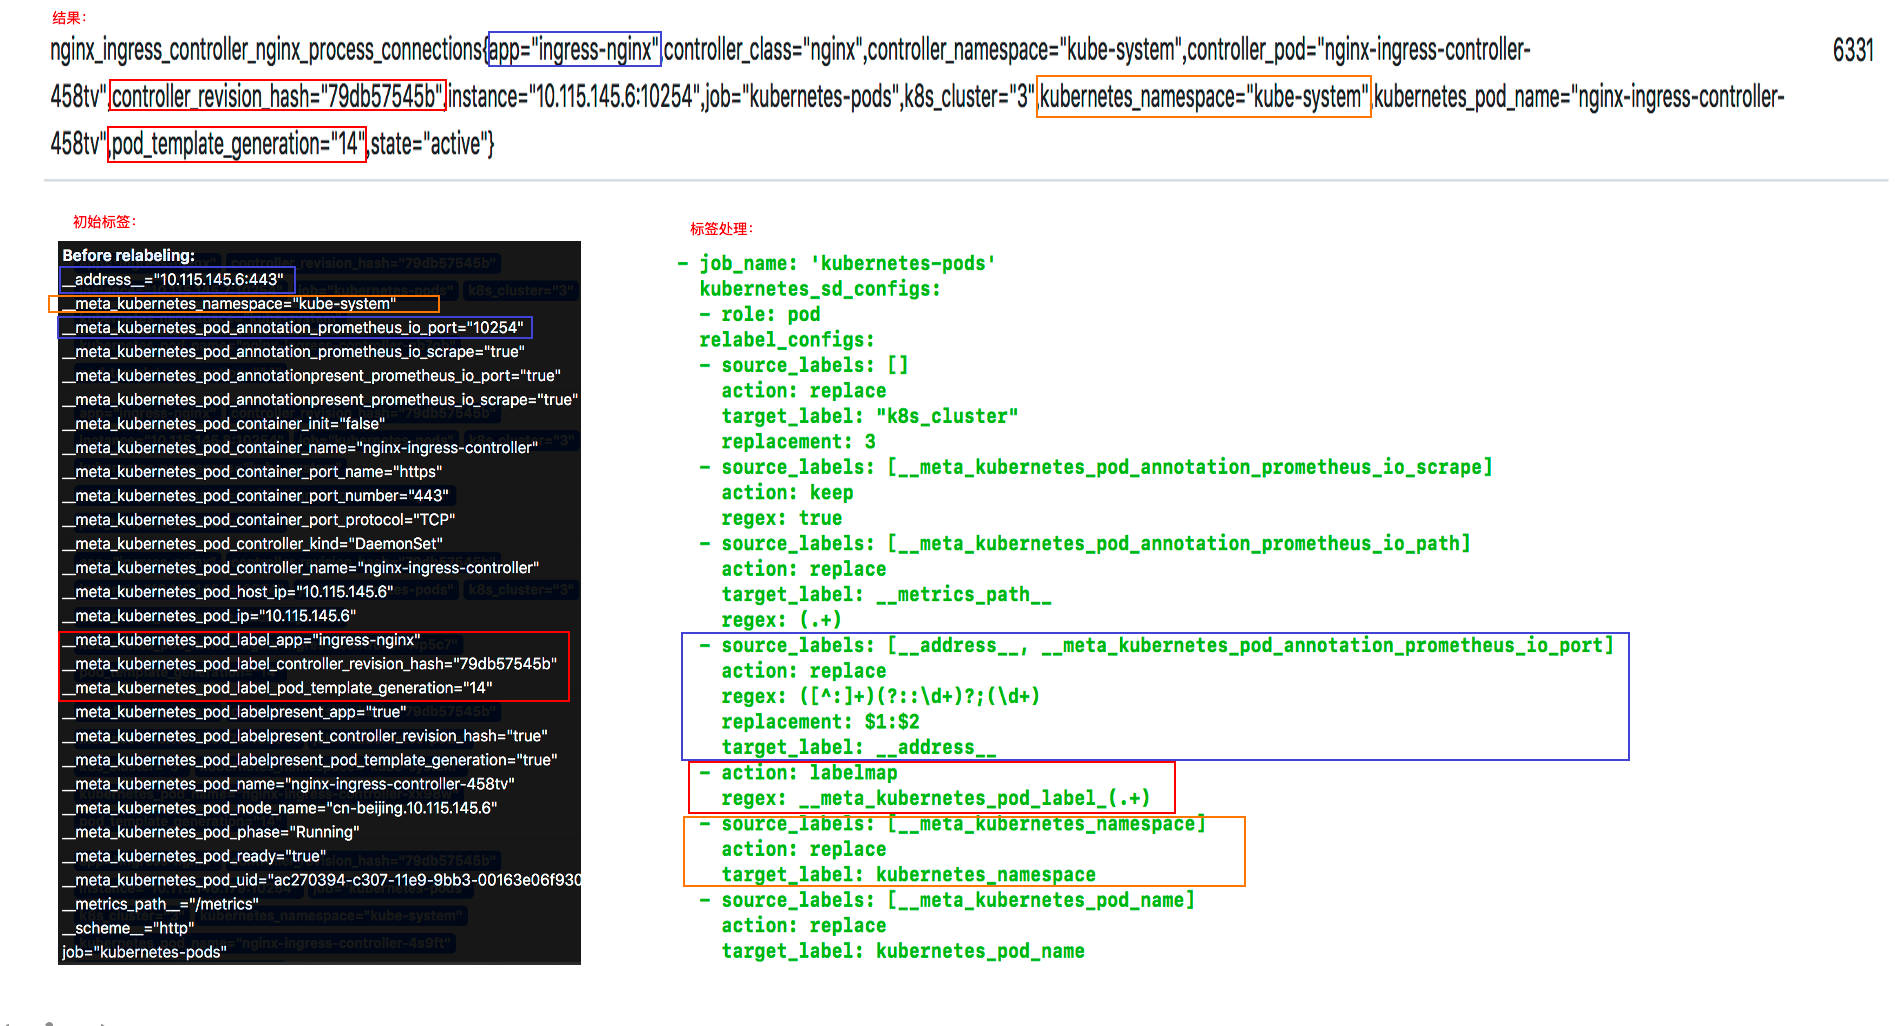
对target重新打标是在数据抓取之前动态重写target标签的强大工具,在每个数据抓取配置中,可以定义多个relabel步骤,它们将按照定义的顺序依次执行;
默认打标操作:对于发现的每个target, Prometheus默认会执行如下操作:
- 将job标签设定为Prometheus配置文件中其所属的job_name的值;
__address__标签的值为该target的套接字地址<host>:<port>- instance标签的值为
__address__的值; __scheme__标签的值为抓取该target上指标时使用的协议(http或https);__metrics_path__标签的值为抓取该target上的指标时使用URI路径,默认为/metrics;__param_<name>标签的值为传递的URL参数中第一个名称为<name>的参数的值(即同一个参数出现多次,只取第一个参数的值);
重新标记期间,还可以使用该target上以__meta__开头的元标签;
- 各服务发现机制为其target添加的元标签会有所不同;
重新标记完成后,该target上以__开头的所有标签都会被移除;
- 若在relabel的过程中需要临时存储标签值,则要使用
__tmp标签名称为前缀进行保存,以避免同Prometheus的内建标签冲突;
relable_configs字段的配置:
# 原标签从现有标签中选择,多个标签在列表中使用逗号分隔,或使用多行模式的yaml列表书写方式。
[ source_labels: '[' <labelname> [, ...] ']' ]

# 所有的原标签值通过指定的分隔符连接成一个字符串,然后应用正则表达式匹配处理
[ separator: <string> | default = ; ]

# replace操作中,source_labels被替换后的标签名
[ target_label: <labelname> ]

# 用来提取值的正则表达式(对于成功匹配的,则进行action操作)。
[ regex: <regex> | default = (.*) ]

# Modulus to take of the hash of the source label values.
# 采用源标签值的散列的模数。在hashmod操作中使用
# 将source_labels字符串进行hash计算,将hash计算的结果作为taget_label的值
[ modulus: <uint64> ]

# 替换后的值,可以使用正则的分组。如果正则表达式不匹配,则不进行替换,而是删除该instance上的此标签
[ replacement: <string> | default = $1 ]

# 对匹配采取的操作,操作有:replace,keep,drop,hashmod,labelmap,labeldrop,labelkeep
[ action: <relabel_action> | default = replace ]
示例:
  - job_name: 'docker'
    static_configs:
    - targets: ['192.168.5.10:8080','192.168.5.11:8080','192.168.5.12:8080']
    metric_relabel_configs:
      # 删除label
      - source_labels: '[__name__]'  #逗号分隔多个
        separator: ','  # 默认为分号
        regex: '(container_tasks_state|container_memory_failures_total)'
        action: drop #默认值为replace
      # 替换标签
      - source_labels: [id]
        target_label: container_id
        regex: '/kubepods/([a-z0-9]+)'
        replacement: '$1'
        action: replace
      # 删除标签
      - regex: 'kernelVersion'
        action: labeldrop
重新标记(relabel_configs)是一个功能强大的工具,可以在目标的标签集被抓取之前重写它,Target以__作为前缀的标签是在系统内部使用的,因此这些标签不会被写入到样本数据中。如果想要将这些标签写入到样本数据中,可以使用relable_configs功能,每个采集配置可以配置多个重写标签设置,并按照配置的顺序来应用于每个目标的标签集。
对于每个metric,除了具有target相关的元数据标签外,还有一个__name__标签,即metric具有如下元数据标签:
__address__:当前Target实例的访问地址<host>:<port>
__scheme__:采集目标服务访问地址的HTTP Scheme,HTTP或者HTTPS
__metrics_path__:采集目标服务访问地址的访问路径
__param_<name>:采集任务目标服务的中包含的请求参数
__name__:metric的名字
目标重新标签之后,以__开头的标签将从标签集中删除的。
如果使用只需要临时的存储临时标签值的,可以使用_tmp作为前缀标识。
action是指重新打标的具体操作。
修改标签key或value
- replace: 对标签和标签值进行替换。
修改标签key,并生成新的标签
- labelmap: 将
regex与所有标签名称匹配(因对所有标签进行匹配,所以无需指定source_labels)。 然后将匹配标签的名称替换为replacement指定的值。(不同于replace,keep,drop,只改变label名,不修改标签值)。注意源标签依然存在。
- labelmap: 将
删除target
- keep:满足特定条件的target进行采集,其他的不采集(注意,keep的客体是target,而不是metric)。
- drop:满足特定条件的target不采集,其他的采集。
删除标签
- labeldrop: 对抓取target的特定标签进行删除。
- labelkeep: 对抓取target的特定标签进行保留,其他标签删除。
其他
- hashmod: 将target_label的值设置为一个整数值,该整数值为
hash(source_labels上各标签的串连值) % modules字段指定的整数,得到的结果赋值为target_label;
- hashmod: 将target_label的值设置为一个整数值,该整数值为
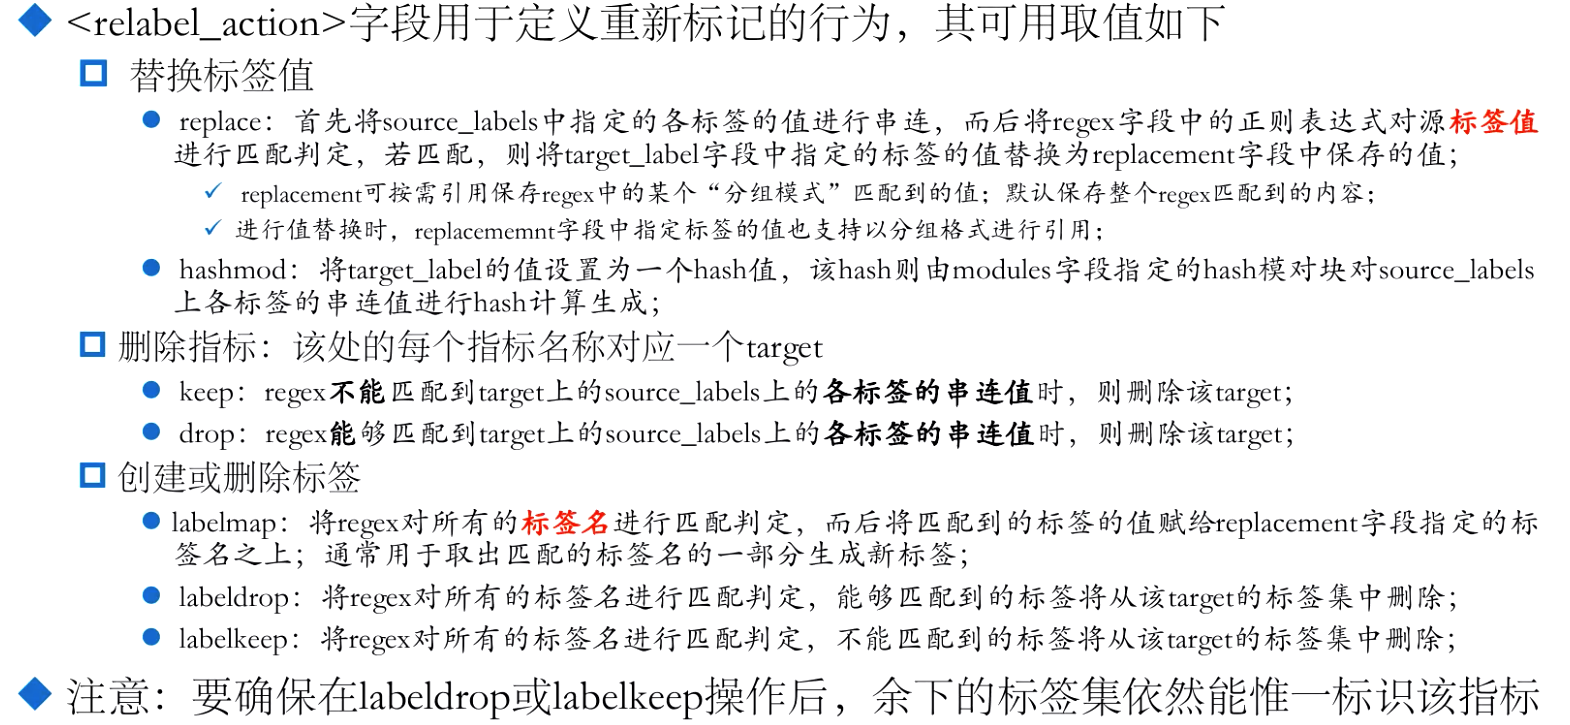
“各标签的串联值”:各个指定的label通过separator连接后的字符串
在测试前,同步下配置文件如下。
scrape_configs:
  # The job name is added as a label `job=<job_name>` to any timeseries scraped from this config.
  - job_name: 'prometheus'

    # metrics_path defaults to '/metrics'
    # scheme defaults to 'http'.

    static_configs:
    - targets: ['localhost:9090']
  - job_name: "node"
    file_sd_configs:
    - refresh_interval: 1m
      files:
      - "/usr/local/prometheus/prometheus/conf/node*.yml"


[root@node00 prometheus]# cat conf/node-dis.yml
- targets:
  - "192.168.100.10:20001"
  labels:
    __hostname__: node00
    __businees_line__: "line_a"
    __region_id__: "cn-beijing"
    __availability_zone__: "a"
- targets:
  - "192.168.100.11:20001"
  labels:
    __hostname__: node01
    __businees_line__: "line_a"
    __region_id__: "cn-beijing"
    __availability_zone__: "a"
- targets:
  - "192.168.100.12:20001"
  labels:
    __hostname__: node02
    __businees_line__: "line_c"
    __region_id__: "cn-beijing"
    __availability_zone__: "b"
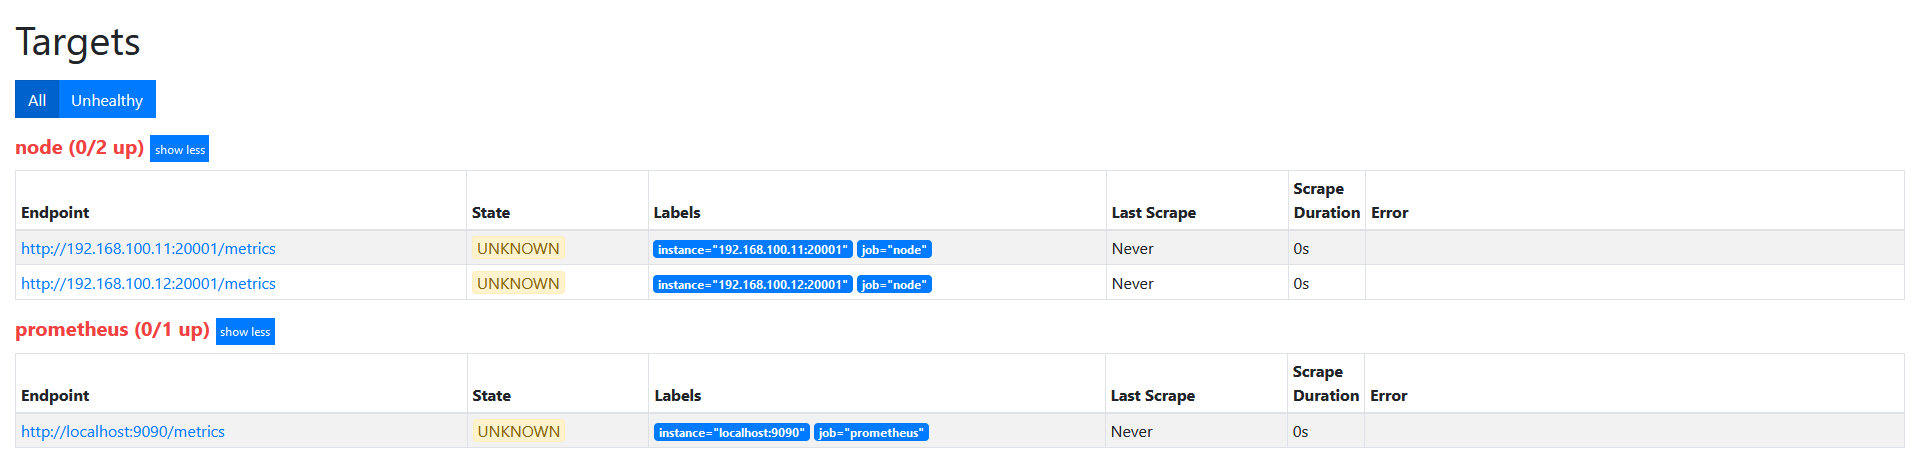
此时如果查看target信息,如下图。
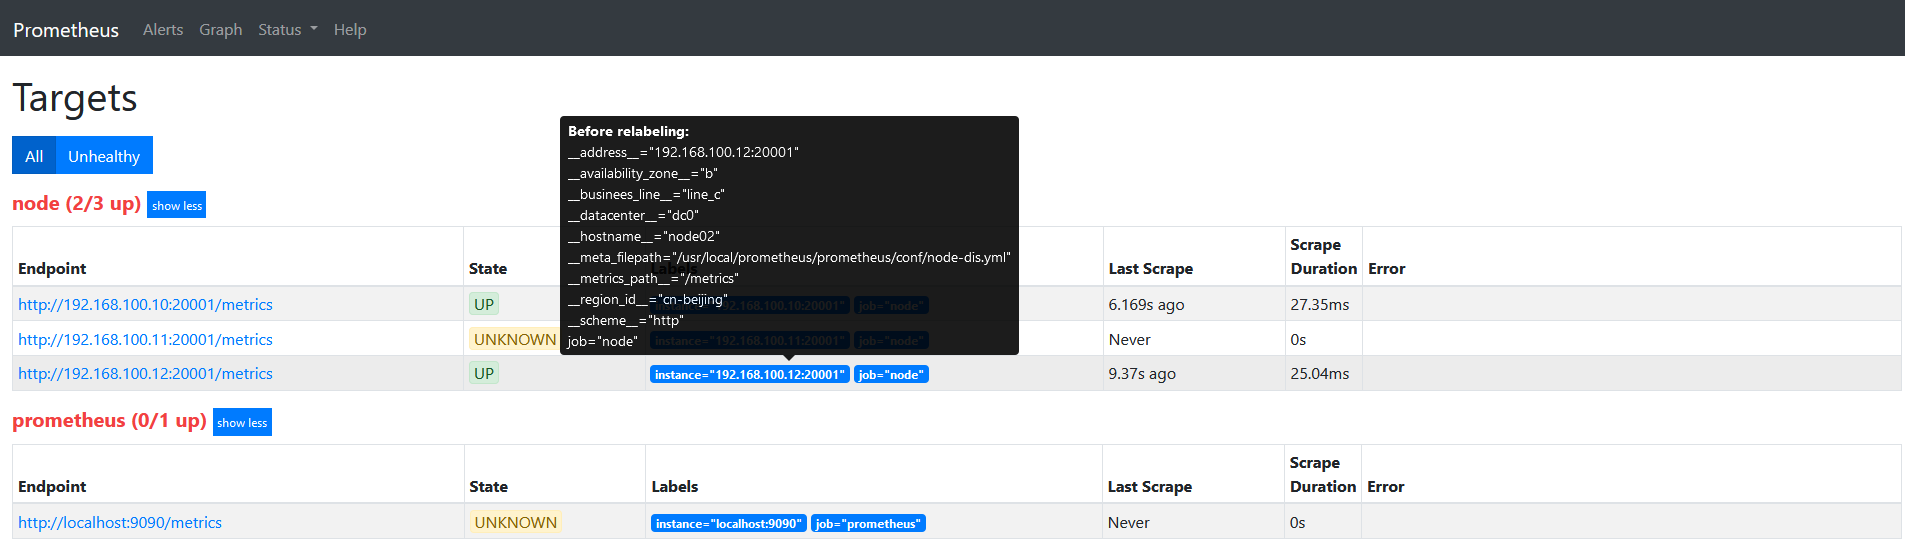
因为我们的label都是以__开头的,目标重新标签之后,以__开头的标签将从标签集中删除的。
将labels中的__hostname__替换为node_name。
scrape_configs:
  # The job name is added as a label `job=<job_name>` to any timeseries scraped from this config.
  - job_name: 'prometheus'

    # metrics_path defaults to '/metrics'
    # scheme defaults to 'http'.

    static_configs:
    - targets: ['localhost:9090']
  - job_name: "node"
    file_sd_configs:
    - refresh_interval: 1m
      files:
      - "/usr/local/prometheus/prometheus/conf/node*.yml"
    relabel_configs:
    - source_labels:
      - "__hostname__"
      regex: "(.*)"
      target_label: "nodename"
      action: replace
      replacement: "$1"
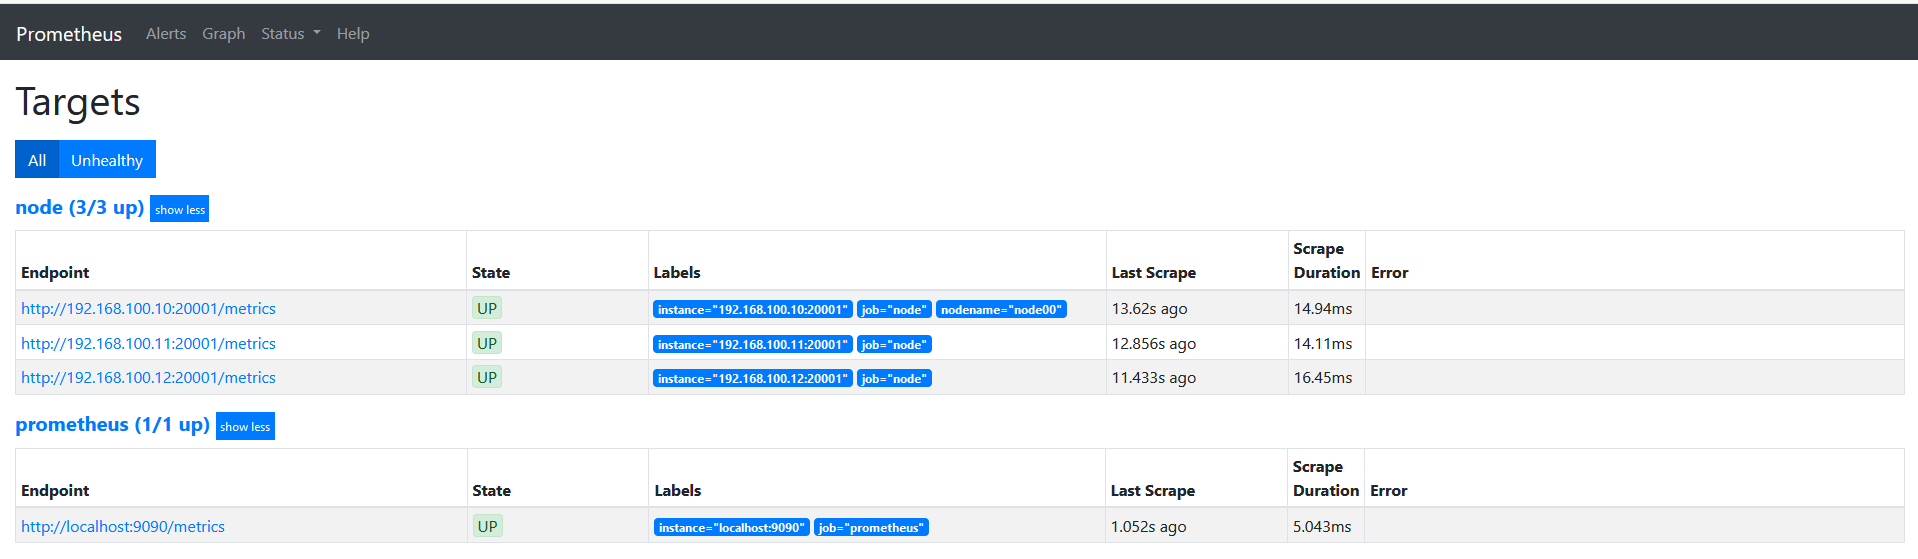
重启服务查看target信息如下图:
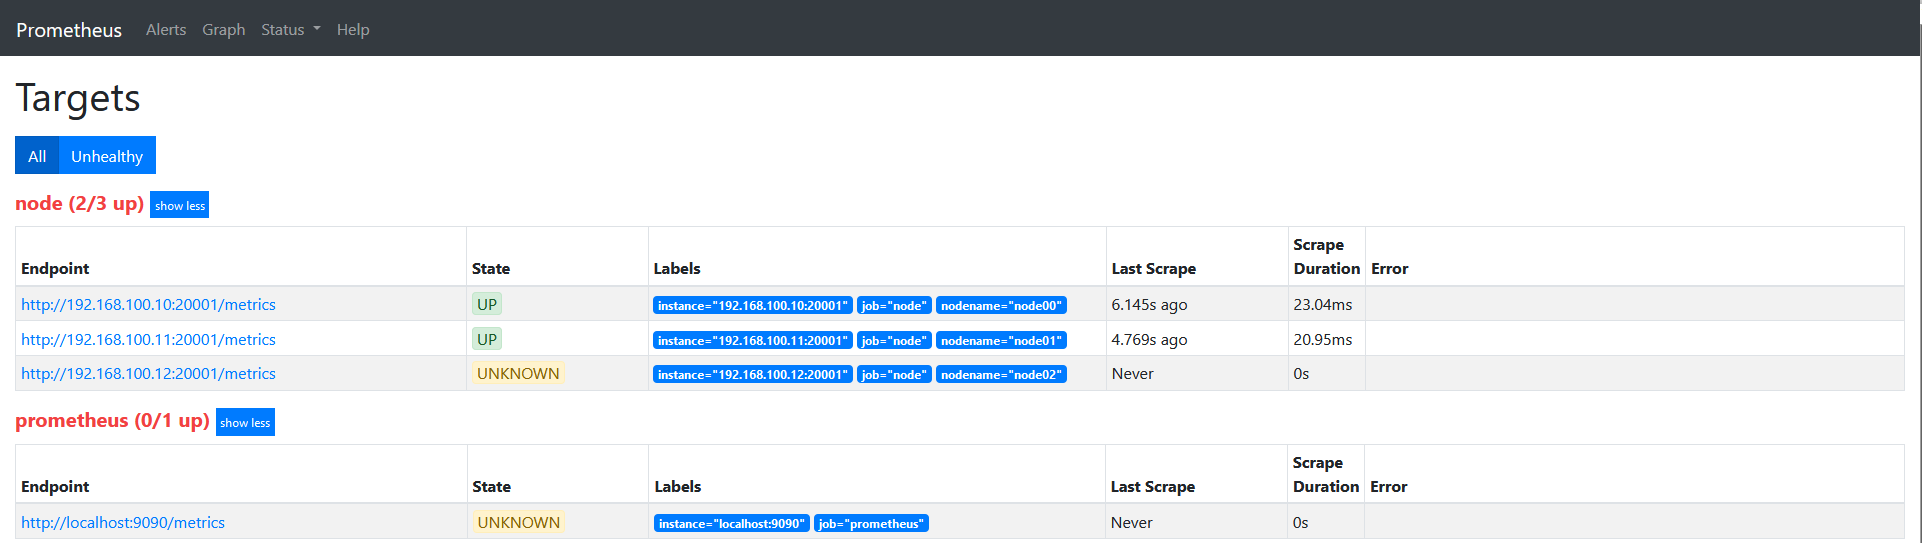
说下上面的配置: source_labels指定我们我们需要处理的源标签, target_labels指定了我们要replace后的标签名字, action指定relabel动作,这里使用replace替换动作。 regex去匹配源标签(__hostname__)的值,(.*)代表__hostname__这个标签是什么值都匹配的,然后replacement指定的替换后的标签(target_label)对应的数值。采用正则引用方式获取的。
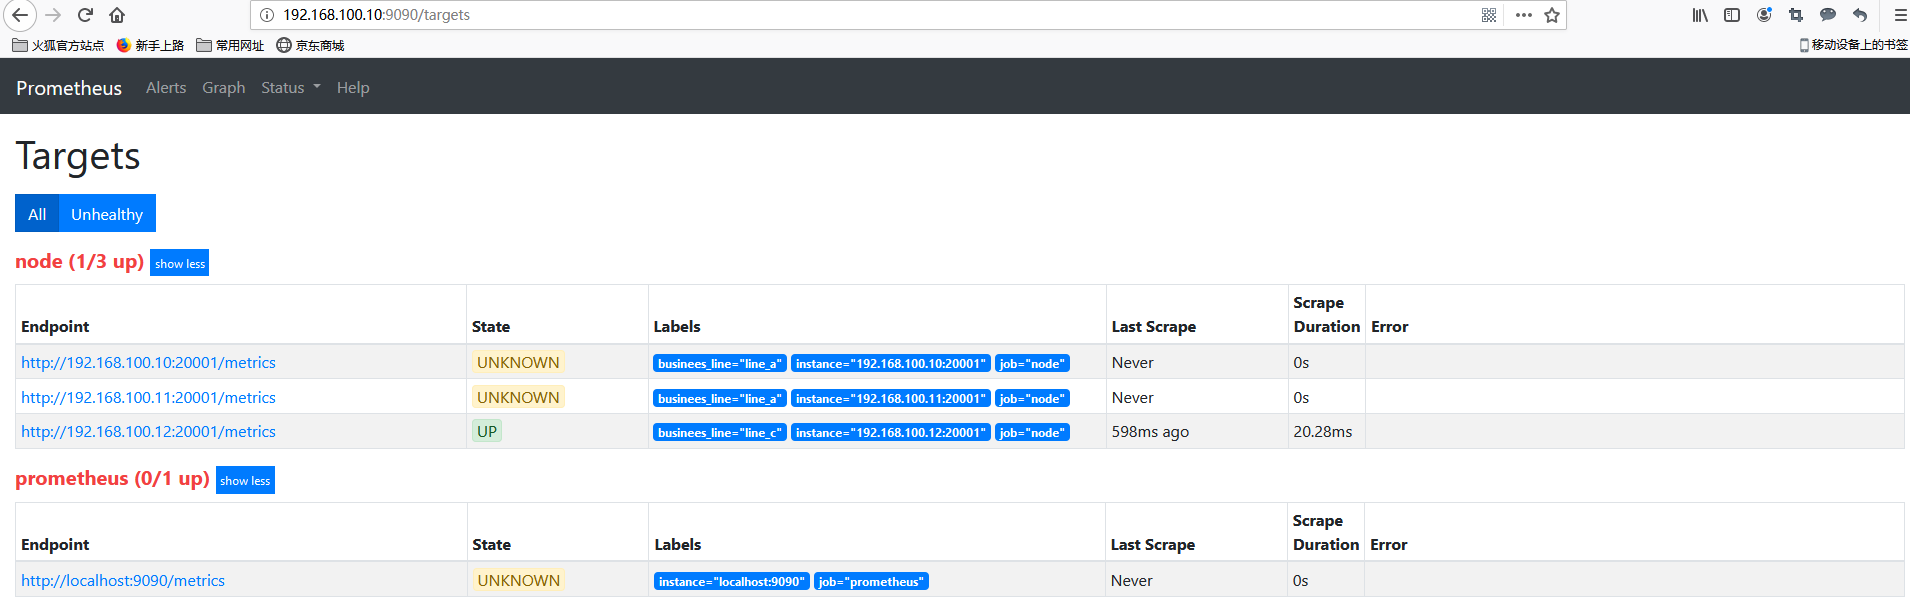
这里修改下上面的正则表达式为 ‘’regex: “(node00)"‘的时候可以看到如下图。发现没有匹配到__hostname__的会被丢弃。
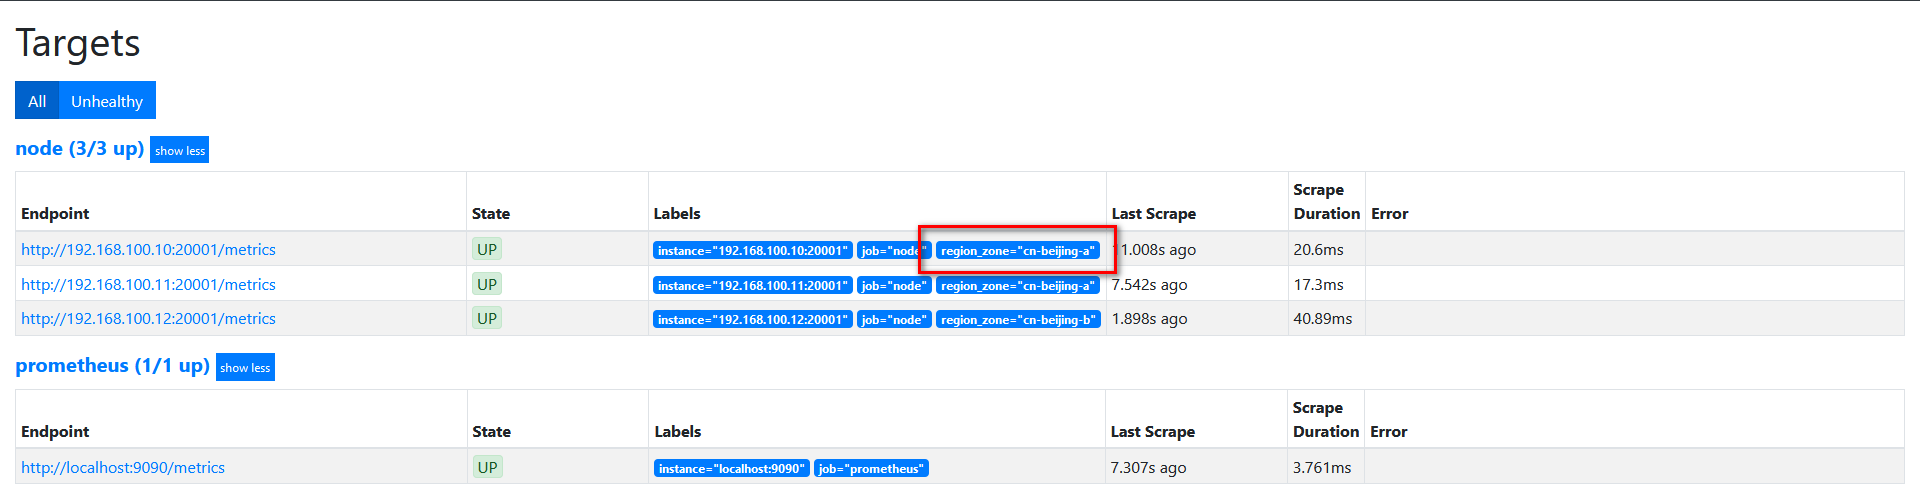
我们的基础信息里面有__region_id__和__availability_zone__,但是我想融合2个字段在一起,可以通过replace来实现。
修改配置如下
scrape_configs:
  # The job name is added as a label `job=<job_name>` to any timeseries scraped from this config.
  - job_name: 'prometheus'

    # metrics_path defaults to '/metrics'
    # scheme defaults to 'http'.

    static_configs:
    - targets: ['localhost:9090']
  - job_name: "node"
    file_sd_configs:
    - refresh_interval: 1m
      files:
      - "/usr/local/prometheus/prometheus/conf/node*.yml"
    relabel_configs:
    - source_labels:
      - "__region_id__"
      - "__availability_zone__"
      separator: "-"
      regex: "(.*)"
      target_label: "region_zone"
      action: replace
      replacement: "$1"
target如下图:
修改配置文件
scrape_configs:
  # The job name is added as a label `job=<job_name>` to any timeseries scraped from this config.
  - job_name: 'prometheus'

    # metrics_path defaults to '/metrics'
    # scheme defaults to 'http'.

    static_configs:
    - targets: ['localhost:9090']
  - job_name: "node"
    file_sd_configs:
    - refresh_interval: 1m
      files:
      - "/usr/local/prometheus/prometheus/conf/node*.yml"
target如下图
修改配置文件如下
scrape_configs:
  # The job name is added as a label `job=<job_name>` to any timeseries scraped from this config.
  - job_name: 'prometheus'

    # metrics_path defaults to '/metrics'
    # scheme defaults to 'http'.

    static_configs:
    - targets: ['localhost:9090']
  - job_name: "node"
    file_sd_configs:
    - refresh_interval: 1m
      files:
      - "/usr/local/prometheus/prometheus/conf/node*.yml"
    relabel_configs:
    - source_labels:
      - "__hostname__"
      regex: "node00"
      action: keep
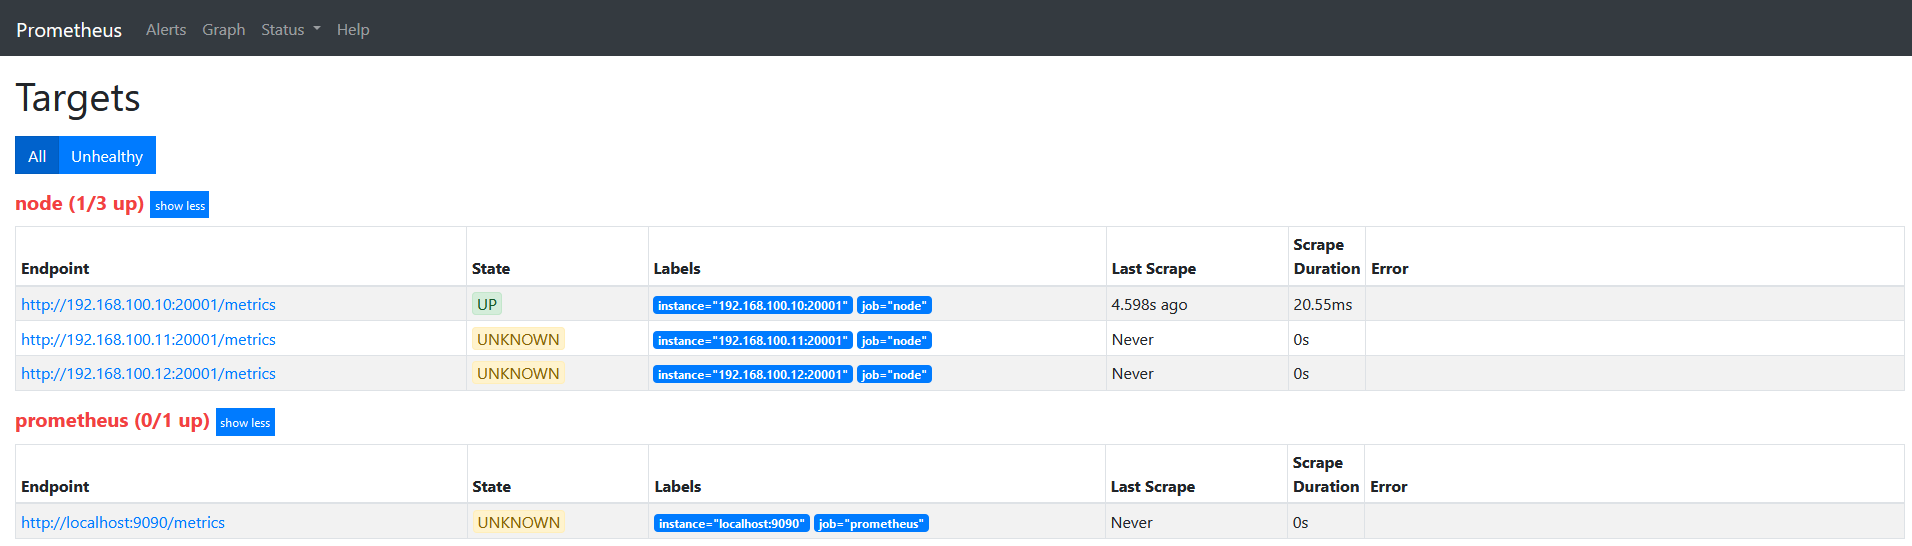
target如下图
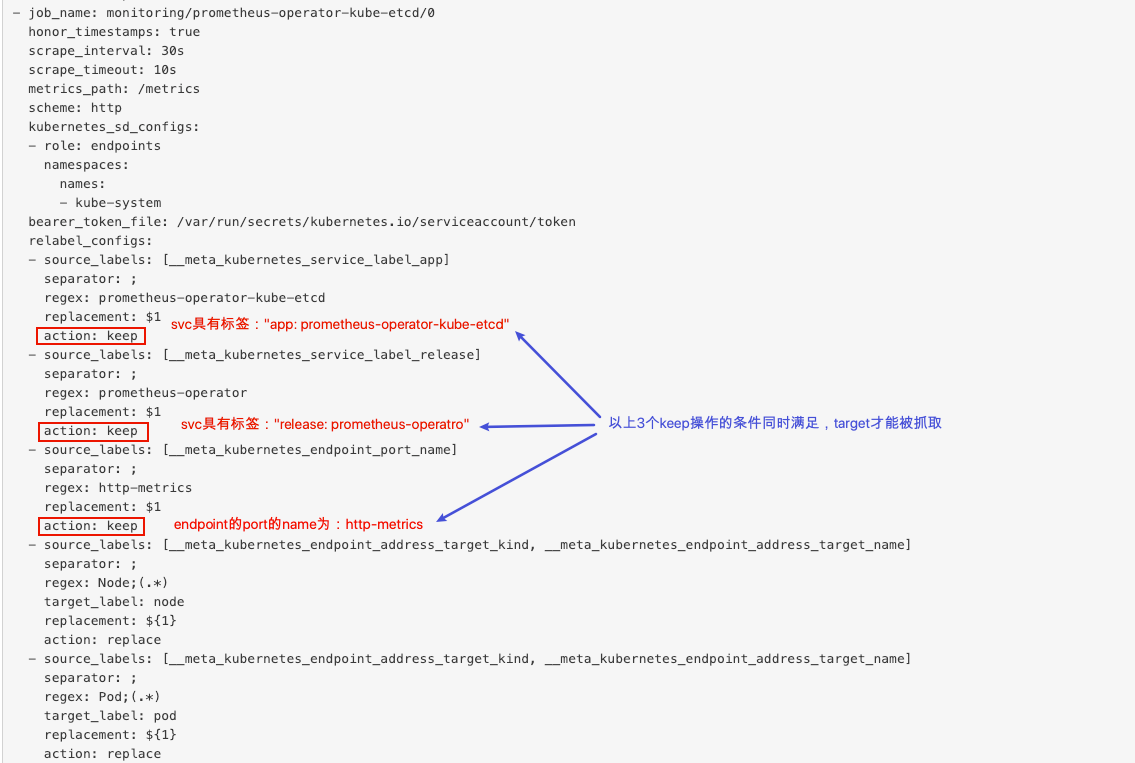
action为keep,只要source_labels的值匹配regex(node00)的实例才能会被采集。 其他的实例不会被采集。此外,如果有多个keep操作的action,则必须同时满足所有的keep条件的target才会被抓取。
在上面的基础上,修改action为drop。
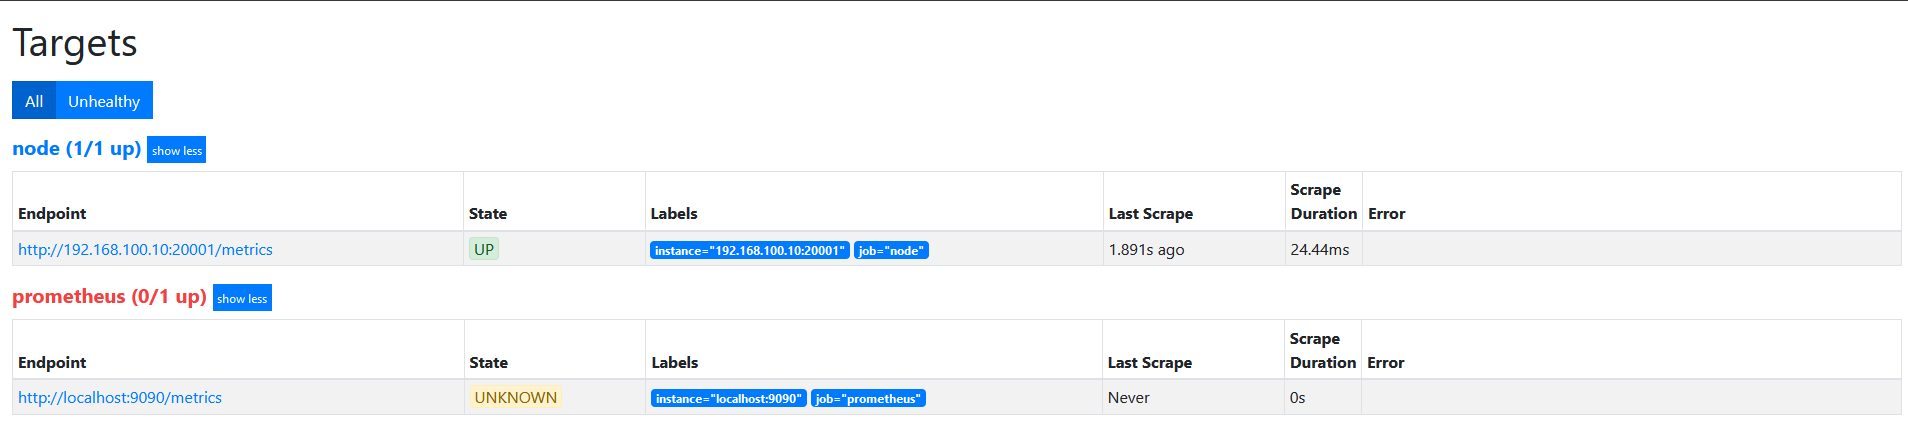
target如下图
action为drop,其实和keep是相似的, 不过是相反的, 只要source_labels的值匹配regex(node00)的实例不会被采集。 其他的实例会被采集。
将regex与所有标签名称匹配。匹配的任何标签都将从标签集中删除。
配置文件如下
scrape_configs:
  # The job name is added as a label `job=<job_name>` to any timeseries scraped from this config.
  - job_name: 'prometheus'

    # metrics_path defaults to '/metrics'
    # scheme defaults to 'http'.

    static_configs:
    - targets: ['localhost:9090']
  - job_name: "node"
    file_sd_configs:
    - refresh_interval: 1m
      files:
      - "/usr/local/prometheus/prometheus/conf/node*.yml"
    relabel_configs:
    - source_labels:
      - "__hostname__"
      regex: "(.*)"
      target_label: "nodename"
      action: replace
      replacement: "$1"
    - source_labels:
      - "__businees_line__"
      regex: "(.*)"
      target_label: "businees_line"
      action: replace
      replacement: "$1"
    - source_labels:
      - "__datacenter__"
      regex: "(.*)"
      target_label: "datacenter"
      action: replace
      replacement: "$1"
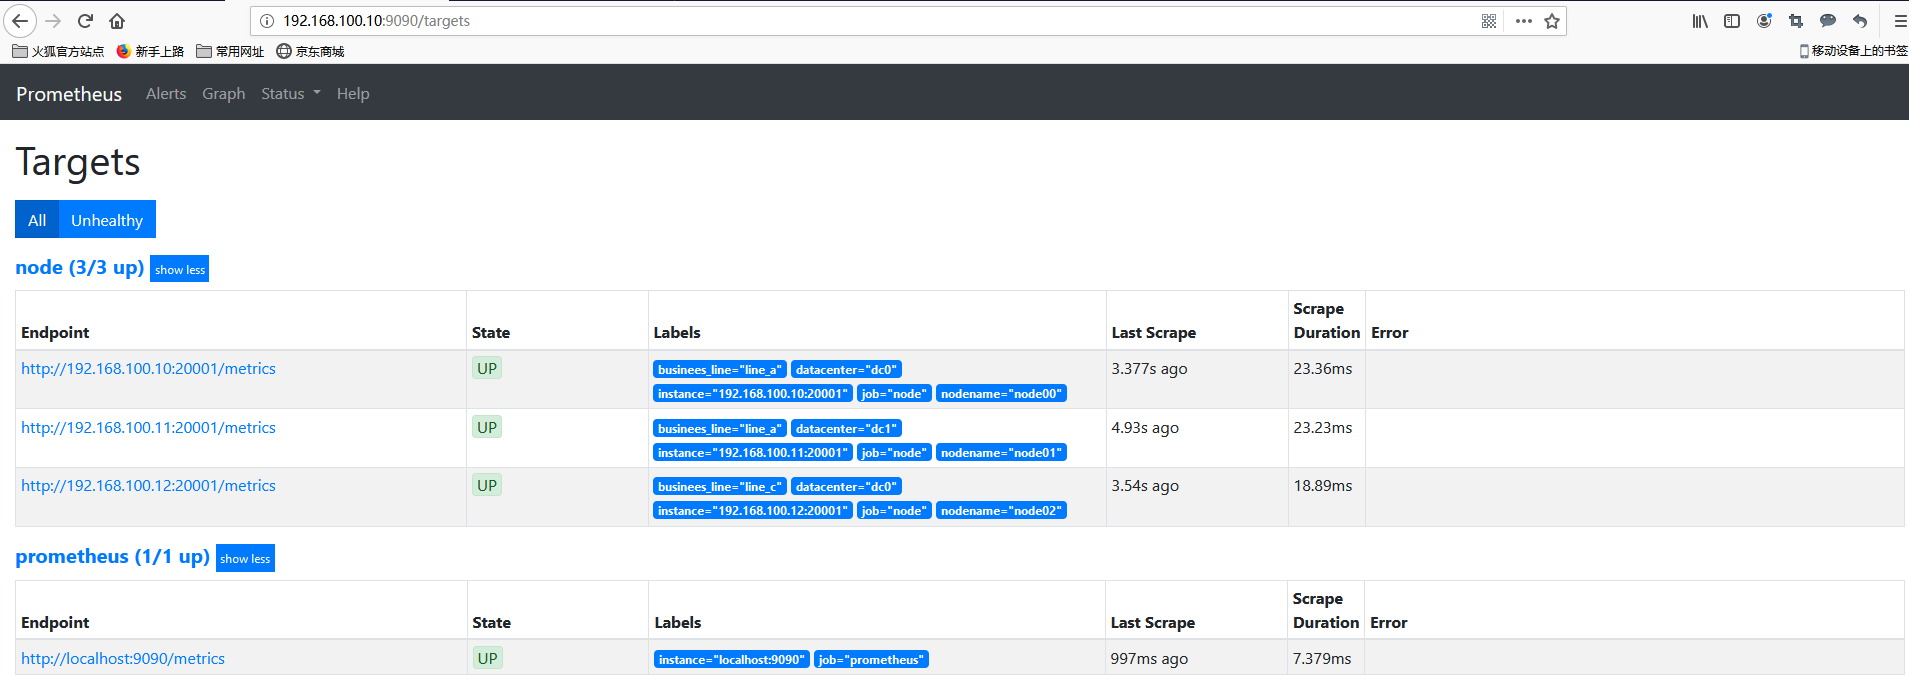
target如下图
修改配置文件如下
scrape_configs:
  # The job name is added as a label `job=<job_name>` to any timeseries scraped from this config.
  - job_name: 'prometheus'

    # metrics_path defaults to '/metrics'
    # scheme defaults to 'http'.

    static_configs:
    - targets: ['localhost:9090']
  - job_name: "node"
    file_sd_configs:
    - refresh_interval: 1m
      files:
      - "/usr/local/prometheus/prometheus/conf/node*.yml"
    relabel_configs:
    - source_labels:
      - "__hostname__"
      regex: "(.*)"
      target_label: "nodename"
      action: replace
      replacement: "$1"
    - source_labels:
      - "__businees_line__"
      regex: "(.*)"
      target_label: "businees_line"
      action: replace
      replacement: "$1"
    - source_labels:
      - "__datacenter__"
      regex: "(.*)"
      target_label: "datacenter"
      action: replace
      replacement: "$1"
    - regex: "(nodename|datacenter)"
      action: labeldrop
target如下图
relable_configs从上往下依次执行,nodename和datacenter标签会被labeldrop这个操作drop掉。
类似labeldrop,将regex与所有标签名称匹配。匹配的任何标签都将从标签集中保留,其他的标签删除。
将regex与所有标签名称匹配。 然后将匹配标签的名称替换为replacement指定的值。(不同于replace,keep,drop,只改变label名,不修改标签值)
scrape_configs:
 - job_name: ec2
   ec2_sd_configs:
   - region: <region>
     access_key: <access key>
     secret_key: <secret key>
#将所有以monitor_开头的标签名替换为去掉monitor_前缀的新标签名字(例如:monitor_foo="bar"-->foo="bar"),但是源标签依然存在。
   relabel_configs:
   - regex: monitor_(.*)
     replacement: '${1}'
     action: labelmap
将target_label设置为连接的source_labels的哈希模数(取模后的值)。
当relabel_config设置为hashmod时,Prometheus会根据modulus的值作为系数,计算source_labels值的hash值。
scrape_configs:
  - job_name: my_job
  # Service discovery etc. goes here.
    relabel_configs:
    #prometheus从特定targets随机抓取数据量的10%
    - source_labels: [__address__]
      modulus: 10
      target_label: __tmp_hash
      action: hashmod
    - source_labels: [__tmp_hash]
      regex: 0   #指定抓取的目标
      action: keep
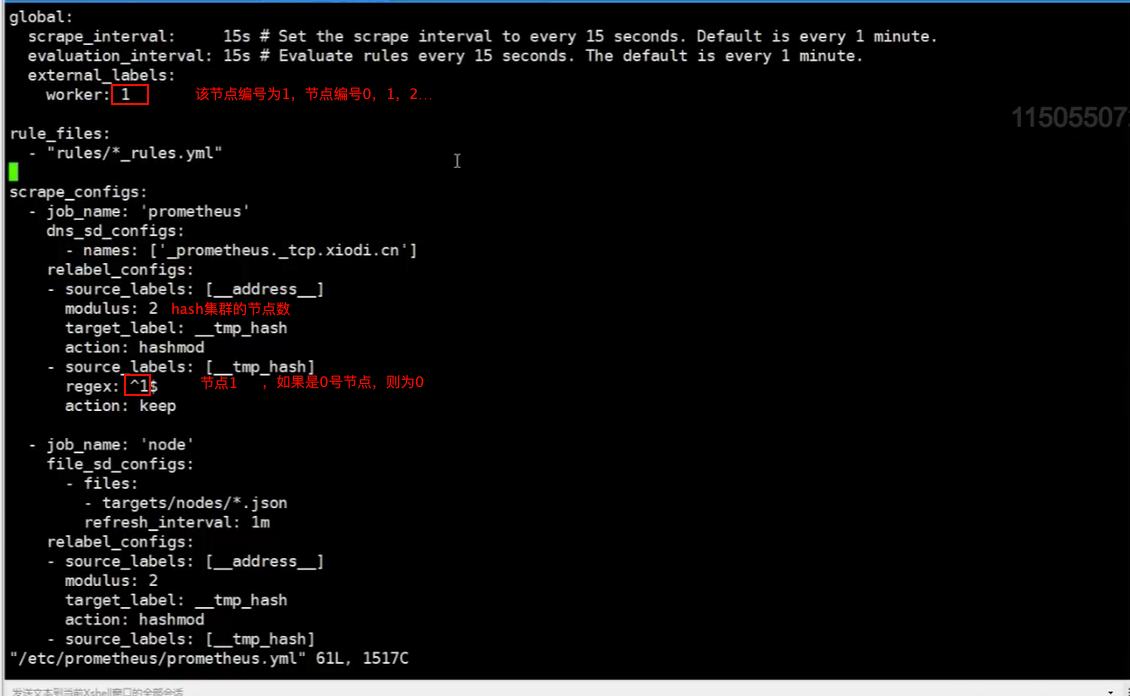
hashmod实战:hashmod+联邦
实现联邦中不同的成员抓取不同的target,使target组中的metrics不被联邦成员重复抓取。
2个work使用hashmode:
scrape_configs:
  - job_name: some_job
    relabel_configs:
    - source_labels: [__address__]
      modulus:       4
      target_label:  __tmp_hash
      action:        hashmod
    - source_labels: [__tmp_hash]
      regex:         ^1$
      action:        keep
上例中利用了Hashmod的能力在Target实例级别实现对采集任务的功能分区的。
relabel_configs是针对target指标采集前和采集中的筛选,而metric_relabel_configs是针对指标采集后(保存前)的筛选。譬如relabel_configs drop动作,那么relabel_configs将不会收集这个指标。而metric_relabel_configs使用的时候指标已经采集过了(但是仍没有保存为时间序列)。所以metric_relabel_configs相对来说,更加昂贵,毕竟指标已经采集了。此外metric_relabel_configs还可以不用指定source_labels。
对metric重新打标是在数据抓取之后动态重写metric标签的工具,在每个数据抓取配置中,可以定义多个metric relabel的步骤,它们将按照定义的顺序依次执行;
- 删除不必要的指标;
- 从指标中删除敏感或不需要的标签;
- 添加、编辑或修改指标的标签值或标签格式:
对metric重新打标的配置格式与target重新打标的格式相同,但前者要定义在专用的metric_relabel_configs字段中;但是要注意的是,更改或添加标签会创建新的时间序列;
- 应该明确地使用各个标签,并尽可能保持不变,以避免创建出一个动态的数据环境;
- 标签是时间序列的唯一性约束,删除标签并导致时间序列重复时,可能会导致系统出现问题;
在source_labels字段上,通过指标上元标签__name__引用指标名称,而后由regex进行匹配判定,可使用drop action删除匹配的指标,或使用keep action仅保留匹配的指标;
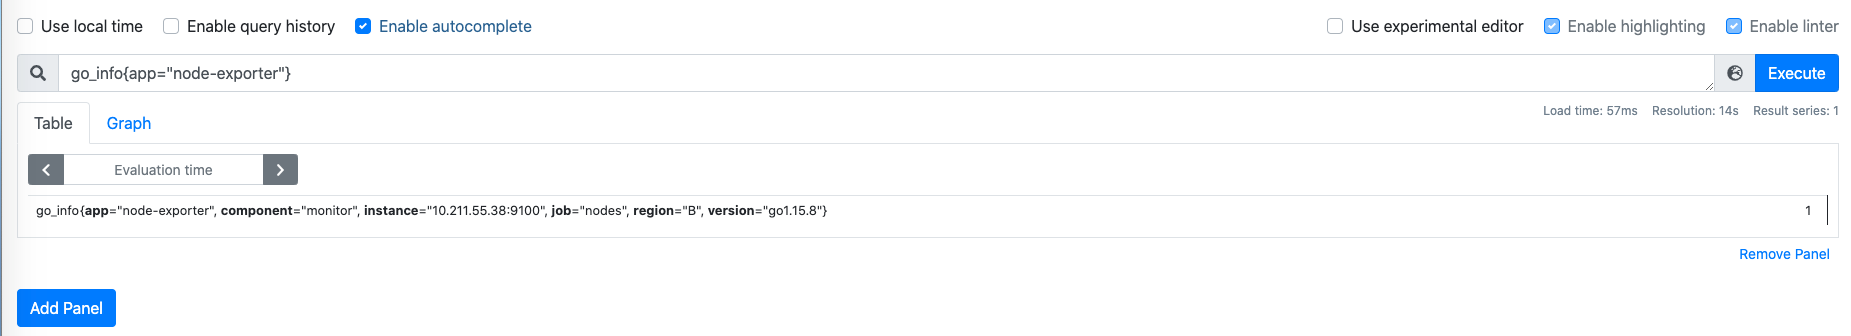
下面的示例,用于在相应的job上,在发现的各target之上,删除以“go_info”为前名称前缀的指标:
- job _name: 'nodes'
  file_sd_configs:
  - files:
    - targets/prometheus/node*.yaml

	metric_relabel_configs:
  - source_labels:
    - __name__
    regex: "go_info.*"
    action: drop
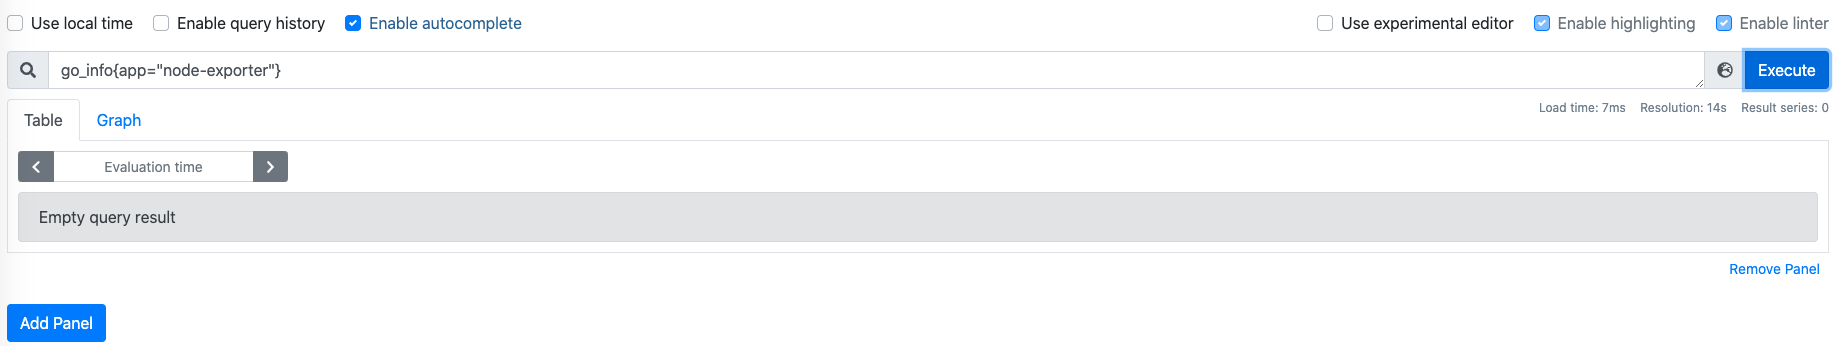
下面的第一个图为执行go_info为前缀的指标删除之前的查询结果,而第二个图则是删除相关指标之后的查询结果;
提示:若删除的指标此前曾由Prometheus抓取并存储过相关的样本数据,则删除操作的需要经过一定的时长后才会反映至查询结果中;