007 Prometheus的数据存储
官方文档:https://prometheus.io/docs/prometheus/latest/storage/#storage
Prometheus内置了TSDB,该存储经历了三个版本;
- v1.0:Leve1DB,性能不高,每秒只能接收50000个样本;
- v2.0:LevelDB,但使用了Facebook的Gorila压缩算法,极大地压缩了单个样本的大小,每秒可接收的样本提升到80000个;
- V3.0:由Prometheus2.0时引入,是一个独立维护的TSDB开源项目;在单机上,每秒可处理数百万个样本;
- 以每2小时为一个时间窗口,并存储为一个单独的block;
- block会压缩、合并历史数据块,随着压缩合并,其block数量会减少;
- block的大小并不固定,但最小会保存两个小时的数据;
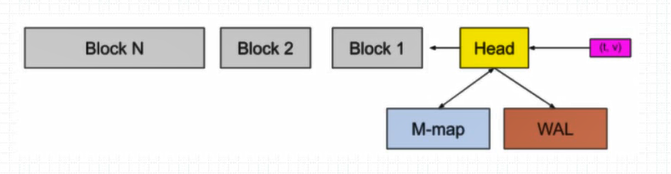
Head(chunks_head)是当前使用的块,保存在内存中。为了数据的持久化,也会通过内存映射和wal机制保存在磁盘上,当时间窗口结束,则将head保存为block。
每个block都有单独的目录,里面包含该时间窗口内所有的chunk、index、tombstones、meta.json
nobody@prometheus-9c5d759b9-85v64:/prometheus$ ls
01G8B0Z98FMBZARJCPGE36RA48  chunks_head  lock  queries.active  wal

nobody@prometheus-9c5d759b9-85v64:/prometheus$ ls 01G8B0Z98FMBZARJCPGE36RA48/
chunks  index  meta.json  tombstones
chunks:用于保存时序数据,每个chunk的大小为512MB,超出该大小时则截断并创建为另一个Chunk;各Chunk以数字编号;
nobody@prometheus-9c5d759b9-85v64:/prometheus$ ls 01G8B0Z98FMBZARJCPGE36RA48/chunks/
000001
index:索引文件,它是Prometheus TSDB实现高效查询的基础;我们甚至可以通过Metrics Name和Labels查找时间序列数据在chunk文件中的位置;索引文件会将指标名称和标签索引到样本数据的时间序列中;
tombstones:用于对数据进行软删除,即“标记删除”,以降低删除操作的成本;删除的记录并保存于tombstones文件中,而读取时间序列上的数据时,会基于tombstones进行过滤已经删除的部分;删除数据会在下一次block合并时,真正被删除。
meta.json:block的元数据信息,这些元数据信息是block的合并、删除等操作的基础依赖
在前面的图中,Head块是数据库位于内存中的部分,Block(灰色块)是磁盘上不可更改的持久块,而预写日志(WAL)用于辅助完成持久写入;
传入的样本(t,v)首先会进入Head,并在内存中停留一会儿,然后即会被刷写到磁盘并映射进内存中(M-map);
当这些内存映射的块或内存中的块老化到一定程度时,它会将作为持久块刷写到磁盘;
随着它们的老化进程,将合并更多的块,最在超过保留期限后被删除;
WAL是数据库中发生的事件的顺序日志,在写入/修改/删除数据库中的数据之前,首先将事件记录(附加)到WAL中,然后在数据库中执行必要的操作;
- WAL的关键点在于,用于帮助TSDB先写日志,再写磁盘上的Block;
- WAL被分割为默认为128MB大小的文件段,它们都位于WAL目录下;
- 使用WAL技术可以方便地进行圆润、重试等操作;
WAL日志的数量及截断的位置则保存于checkpoint文件中,该文件的内容要同步写入磁盘,以确保其可靠性;
配置参数
–storage.tsdb.path:数据存储路径,WAL日志亦会存储于该目录下,默认为data;
–storage.tsdb.retention.time:样本数据在存储中保存的时长,超过该时长的数据就会被删除;默认为15d;
–storage.tsdb.retention.size:每个Block的最大字节数(不包括WAL文件),支持B、KB、MB、GB、TB、PB和EB,例如512MB等;
–storage.tsdb.wal-compression:是否启用WAL的压缩机制,2.20及以后的版本中默认即为启用;
容量规划
needed_disk_space=retention_time_seconds * ingested_samples_per_second * bytes_per_sample
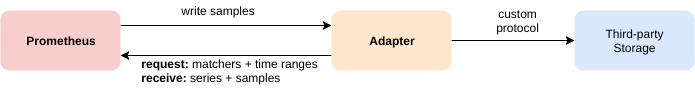
Prometheus可通过基于gRPC的适配器对接到远程存储,适配器主要处理“读”和“写”两种数据操作,它们可分别通过不同的URL完成。
# The URL of the endpoint to send samples to.
url: <string>

# Timeout for requests to the remote write endpoint.
[ remote_timeout: <duration> | default = 30s ]

# Custom HTTP headers to be sent along with each remote write request.
# Be aware that headers that are set by Prometheus itself can't be overwritten.
headers:
  [ <string>: <string> ... ]

# List of remote write relabel configurations.
write_relabel_configs:
  [ - <relabel_config> ... ]

# Name of the remote write config, which if specified must be unique among remote write configs.
# The name will be used in metrics and logging in place of a generated value to help users distinguish between
# remote write configs.
[ name: <string> ]

# Enables sending of exemplars over remote write. Note that exemplar storage itself must be enabled for exemplars to be scraped in the first place.
[ send_exemplars: <boolean> | default = false ]

# Sets the `Authorization` header on every remote write request with the
# configured username and password.
# password and password_file are mutually exclusive.
basic_auth:
  [ username: <string> ]
  [ password: <secret> ]
  [ password_file: <string> ]

# Optional `Authorization` header configuration.
authorization:
  # Sets the authentication type.
  [ type: <string> | default: Bearer ]
  # Sets the credentials. It is mutually exclusive with
  # `credentials_file`.
  [ credentials: <secret> ]
  # Sets the credentials to the credentials read from the configured file.
  # It is mutually exclusive with `credentials`.
  [ credentials_file: <filename> ]

# Optionally configures AWS's Signature Verification 4 signing process to
# sign requests. Cannot be set at the same time as basic_auth, authorization, or oauth2.
# To use the default credentials from the AWS SDK, use `sigv4: {}`.
sigv4:
  # The AWS region. If blank, the region from the default credentials chain
  # is used.
  [ region: <string> ]

  # The AWS API keys. If blank, the environment variables `AWS_ACCESS_KEY_ID`
  # and `AWS_SECRET_ACCESS_KEY` are used.
  [ access_key: <string> ]
  [ secret_key: <secret> ]

  # Named AWS profile used to authenticate.
  [ profile: <string> ]

  # AWS Role ARN, an alternative to using AWS API keys.
  [ role_arn: <string> ]

# Optional OAuth 2.0 configuration.
# Cannot be used at the same time as basic_auth, authorization, or sigv4.
oauth2:
  [ <oauth2> ]

# Configures the remote write request's TLS settings.
tls_config:
  [ <tls_config> ]

# Optional proxy URL.
[ proxy_url: <string> ]

# Configure whether HTTP requests follow HTTP 3xx redirects.
[ follow_redirects: <bool> | default = true ]

# Configures the queue used to write to remote storage.
queue_config:
  # Number of samples to buffer per shard before we block reading of more
  # samples from the WAL. It is recommended to have enough capacity in each
  # shard to buffer several requests to keep throughput up while processing
  # occasional slow remote requests.
  [ capacity: <int> | default = 2500 ]
  # Maximum number of shards, i.e. amount of concurrency.
  [ max_shards: <int> | default = 200 ]
  # Minimum number of shards, i.e. amount of concurrency.
  [ min_shards: <int> | default = 1 ]
  # Maximum number of samples per send.
  [ max_samples_per_send: <int> | default = 500]
  # Maximum time a sample will wait in buffer.
  [ batch_send_deadline: <duration> | default = 5s ]
  # Initial retry delay. Gets doubled for every retry.
  [ min_backoff: <duration> | default = 30ms ]
  # Maximum retry delay.
  [ max_backoff: <duration> | default = 5s ]
  # Retry upon receiving a 429 status code from the remote-write storage.
  # This is experimental and might change in the future.
  [ retry_on_http_429: <boolean> | default = false ]

# Configures the sending of series metadata to remote storage.
# Metadata configuration is subject to change at any point
# or be removed in future releases.
metadata_config:
  # Whether metric metadata is sent to remote storage or not.
  [ send: <boolean> | default = true ]
  # How frequently metric metadata is sent to remote storage.
  [ send_interval: <duration> | default = 1m ]
  # Maximum number of samples per send.
  [ max_samples_per_send: <int> | default = 500]
# The URL of the endpoint to query from.
url: <string>

# Name of the remote read config, which if specified must be unique among remote read configs.
# The name will be used in metrics and logging in place of a generated value to help users distinguish between
# remote read configs.
[ name: <string> ]

# An optional list of equality matchers which have to be
# present in a selector to query the remote read endpoint.
required_matchers:
  [ <labelname>: <labelvalue> ... ]

# Timeout for requests to the remote read endpoint.
[ remote_timeout: <duration> | default = 1m ]

# Custom HTTP headers to be sent along with each remote read request.
# Be aware that headers that are set by Prometheus itself can't be overwritten.
headers:
  [ <string>: <string> ... ]

# Whether reads should be made for queries for time ranges that
# the local storage should have complete data for.
[ read_recent: <boolean> | default = false ]

# Sets the `Authorization` header on every remote read request with the
# configured username and password.
# password and password_file are mutually exclusive.
basic_auth:
  [ username: <string> ]
  [ password: <secret> ]
  [ password_file: <string> ]

# Optional `Authorization` header configuration.
authorization:
  # Sets the authentication type.
  [ type: <string> | default: Bearer ]
  # Sets the credentials. It is mutually exclusive with
  # `credentials_file`.
  [ credentials: <secret> ]
  # Sets the credentials to the credentials read from the configured file.
  # It is mutually exclusive with `credentials`.
  [ credentials_file: <filename> ]

# Optional OAuth 2.0 configuration.
# Cannot be used at the same time as basic_auth or authorization.
oauth2:
  [ <oauth2> ]

# Configures the remote read request's TLS settings.
tls_config:
  [ <tls_config> ]

# Optional proxy URL.
[ proxy_url: <string> ]

# Configure whether HTTP requests follow HTTP 3xx redirects.
[ follow_redirects: <bool> | default = true ]
默认情况下prometheus会将采集的数据防止到本机的data目录的, 存储数据的大小受限和扩展不便,这是使用influxdb作为后端的数据库来存储数据。
influxdb的官方文档地址为: https://docs.influxdata.com/influxdb/v1.7/introduction/downloading/ 根据不同系统进行下载,这里使用官方提供的rpm进行安装。
# 获取软件包
$ wget https://dl.influxdata.com/influxdb/releases/influxdb-1.7.8.x86_64.rpm
# 本地安装
$ yum localinstall influxdb-1.7.8.x86_64.rpm

# 备份默认的默认的配置文件,这里可以对influxdb的数据存放位置做些设置
$ cp /etc/influxdb/influxdb.conf  /etc/influxdb/influxdb.conf.default

# 启动
$ systemctl start influxdb && systemctl enable influxdb
# 查看状态
$ systemctl status influxdb
# 查看端口是否监听
$ ss -lnput | grep 8086
tcp    LISTEN     0      1024     :::8086                 :::*                   users:(("influxd",pid=9405,fd=5))
$ influx                                     # 登录influxdb数据库
> create database prometheus;                # 创建prometheus数据库
> show databases;                            # 查看数据库
name: databases
name
----
_internal
prometheus
> exit                                          # 退出
官方的帮助文档在这里: https://docs.influxdata.com/influxdb/v1.7/supported_protocols/prometheus/
$ vim /usr/local/prometheus/prometheus.yml
# 添加如下几行
remote_write:
  - url: "http://10.4.7.100:8086/api/v1/prom/write?db=prometheus"
remote_read:
  - url: "http://10.4.7.100:8086/api/v1/prom/read?db=prometheus"

$ systemctl restart prometheus
$ systemctl status prometheus
注意: 如果influxdb配置有密码, 请参考上面的官方文档地址进行配置。
$ influx
> show databases;
name: databases
name
----
_internal
prometheus
> use prometheus
Using database prometheus
> show measures;
ERR: error parsing query: found measures, expected CONTINUOUS, DATABASES, DIAGNOSTICS, FIELD, GRANTS, MEASUREMENT, MEASUREMENTS, QUERIES, RETENTION, SERIES, SHARD, SHARDS, STATS, SUBSCRIPTIONS, TAG, USERS at line 1, char 6
> show MEASUREMENTS;
name: measurements
name
----
go_gc_duration_seconds
go_gc_duration_seconds_count
go_gc_duration_seconds_sum
go_goroutines
go_info
go_memstats_alloc_bytes
# 后面还是有很多,这里不粘贴了。

# 做个简单查询
> select * from prometheus_http_requests_total limit 10 ;
name: prometheus_http_requests_total
time                __name__                       code handler  instance       job        value
----                --------                       ---- -------  --------       ---        -----
1568975686217000000 prometheus_http_requests_total 200  /metrics localhost:9090 prometheus 1
1568975701216000000 prometheus_http_requests_total 200  /metrics localhost:9090 prometheus 2
1568975716218000000 prometheus_http_requests_total 200  /metrics localhost:9090 prometheus 3
1568975731217000000 prometheus_http_requests_total 200  /metrics localhost:9090 prometheus 4
1568975746216000000 prometheus_http_requests_total 200  /metrics localhost:9090 prometheus 5
1568975761217000000 prometheus_http_requests_total 200  /metrics localhost:9090 prometheus 6
1568975776217000000 prometheus_http_requests_total 200  /metrics localhost:9090 prometheus 7
1568975791217000000 prometheus_http_requests_total 200  /metrics localhost:9090 prometheus 8
1568975806217000000 prometheus_http_requests_total 200  /metrics localhost:9090 prometheus 9
1568975821216000000 prometheus_http_requests_total 200  /metrics localhost:9090 prometheus 10