Blackbox Exporter监控文档
prometheus–>blackbox-exporter(相当于代理服务器)–>target。
也可以使用curl命令对blackbox-exporter发送请求:
curl "http://10.108.196.52:9115/probe?target=https://www.baidu.com&module=http_2xx"
cat >>"EOF" |kubectl apply -f -
apiVersion: v1
kind: ConfigMap
metadata:
  name: blackbox-config
  namespace: cattle-prometheus
data:
  blackbox.yml: |-
    modules:  #Blackbox-Exporter中所有的探针均是以 Module 的信息进行配置,模块名字自定义
      http_2xx:  # http Get请求 检测模块
        prober: http
        timeout: 10s
        http:
          valid_http_versions: ["HTTP/1.1", "HTTP/2"]
          valid_status_codes: [200,301,302,308]
          method: GET
          no_follow_redirects: false
          preferred_ip_protocol: "ip4"  #默认ipv6 ,目前国内使用ipv6很少。
      http_post_2xx: # http post 监测模块
        prober: http
        timeout: 10s
        http:
          valid_http_versions: ["HTTP/1.1", "HTTP/2"]
          method: POST
          preferred_ip_protocol: "ip4"
          # headers:
          #   Content-Type: application/json ##header头
          # body: '{"hmac":"","params":{"publicFundsKeyWords":"xxx"}}' ##传参
      tcp_connect:  # TCP 检测模块
        prober: tcp
        timeout: 10s
      dns:  # DNS 检测模块
        prober: dns
        dns:
          transport_protocol: "tcp"  # 默认是 udp
          preferred_ip_protocol: "ip4"  # 默认是 ip6
          query_name: "kubernetes.default.svc.cluster.local"
---
apiVersion: apps/v1
kind: Deployment
metadata:
  name: blackbox
  namespace: cattle-prometheus
spec:
  selector:
    matchLabels:
      app: blackbox
  template:
    metadata:
      labels:
        app: blackbox
    spec:
      containers:
      - image: prom/blackbox-exporter:v0.17.0
        name: blackbox
        args:
        - --config.file=/etc/blackbox_exporter/blackbox.yml # ConfigMap 中的配置文件
        - --log.level=error  # 错误级别控制
        ports:
        - containerPort: 9115
        volumeMounts:
        - name: config
          mountPath: /etc/blackbox_exporter
      volumes:
      - name: config
        configMap:
          name: blackbox-config
---
apiVersion: v1
kind: Service
metadata:
  name: blackbox
  namespace: cattle-prometheus
spec:
  selector:
    app: blackbox
  ports:
  - port: 9115
    targetPort: 9115
EOF
直接在prometheus的配置文件中静态指定。例如
- job_name: 'blackbox_http_2xx'
  scrape_interval: 45s
  metrics_path: /probe
  params:
    module: [http_2xx]  # Look for a HTTP 200 response.
  static_configs:
      - targets:
        - https://www.baidu.com/
        - 172.0.0.1:9090
  relabel_configs:
      - source_labels: [__address__]
        target_label: __param_target
      - source_labels: [__param_target]
        target_label: instance
      - target_label: __address__
        replacement: blackbox:9115  # The blackbox exporter's real hostname:port.
apiVersion: monitoring.coreos.com/v1
kind: ServiceMonitor
metadata:
  name: blackbox-oppc-rencaiyoujia-com
  labels:
    release: kube-prometheus-stack  #必须
  namespace: monitoring  #必须为monitoring,Prometheus这个crd中限定了
spec:
  jobLabel: "blackbox-oppc-rencaiyoujia-com"
  endpoints:
  - port: http
    path: "/probe"
    scheme: http
    interval: 60s
    scrapeTimeout: 60s
    params:
      module:
      - http_2xx
      target:
      - https://oppc.rencaiyoujia.com/ping
    metricRelabelings:
      - targetLabel: instance
        replacement: https://oppc.rencaiyoujia.com/ping
      - targetLabel: target
        replacement: blackbox-example
  # 如何匹配blackbox-exporter
  selector:
    matchLabels:
      app.kubernetes.io/name: prometheus-blackbox-exporter
  namespaceSelector:
    matchNames:
      - monitoring
1、定义服务发现的prometheus配置
- job_name: 'kubernetes-http-services'
  metrics_path: /probe
  params:
    module: [http_2xx]  # 使用定义的http模块
  kubernetes_sd_configs:
  - role: service  # service 类型的服务发现
  relabel_configs:
  # 只有service的annotation中配置了 prometheus.io/http_probe=true 的才进行发现
  - source_labels: [__meta_kubernetes_service_annotation_prometheus_io_http_probe]
    action: keep
    regex: true
  - source_labels: [__address__]
    target_label: __param_target
  - target_label: __address__
    replacement: blackbox-exporter:9115  #blackbox-exporter访问地址
  - source_labels: [__param_target]
    target_label: instance
  - action: labelmap
    regex: __meta_kubernetes_service_label_(.+)
  - source_labels: [__meta_kubernetes_namespace]
    target_label: kubernetes_namespace
  - source_labels: [__meta_kubernetes_service_name]
    target_label: kubernetes_name
- job_name: 'kubernetes-ingresses'
  metrics_path: /probe
  params:
    module: [http_2xx]  # 使用定义的http模块
  kubernetes_sd_configs:
  - role: ingress  # ingress 类型的服务发现
  relabel_configs:
  # 只有ingress的annotation中配置了 prometheus.io/http_probe=true的才进行发现,probe_path的值为ingress.spec.path
  - source_labels: [__meta_kubernetes_ingress_annotation_prometheus_io_http_probe]
    action: keep
    regex: true
  - source_labels: [__meta_kubernetes_ingress_scheme,__address__,__meta_kubernetes_ingress_path]
    regex: (.+);(.+);(.+)
    replacement: ${1}://${2}${3}
    target_label: __param_target
  # prometheus.io/http_probe_path=/ping,如果存在该注解,则会将probe_path设置为指定的值,覆盖上一个source_labels的配置
  - source_labels: [__meta_kubernetes_ingress_scheme,__address__,__meta_kubernetes_ingress_annotation_prometheus_io_http_probe_path,__meta_kubernetes_ingress_annotationpresent_prometheus_io_http_probe_path]
    regex: (.+);(.+);(.+);true
    replacement: ${1}://${2}${3}
    target_label: __param_target
  - target_label: __address__
    replacement: blackbox-exporter:9115
  - source_labels: [__param_target]
    target_label: instance
  - action: labelmap
    regex: __meta_kubernetes_ingress_label_(.+)
  - source_labels: [__meta_kubernetes_namespace]
    target_label: kubernetes_namespace
  - source_labels: [__meta_kubernetes_ingress_name]
    target_label: kubernetes_name
- job_name: 'blackbox_http_2xx'
  scrape_interval: 45s
  metrics_path: /probe
  params:
    module: [http_2xx]  # Look for a HTTP 200 response.
  static_configs:  #对于k8s集群外部的服务,无法通过ingress的自动发现,可以使用静态发现
    - targets:
      - https://www.xiaocaiyoujia.com
      - https://www.xiaocaiyoujia.com/h5/
      - https://www.xiaocaiyoujia.com/h5_ent/
2、在svc或ing中添加相关的注解信息
只有service的annotation中配置了 prometheus.io/http_probe=true 的才进行发现
只有ingress的annotation中配置了 prometheus.io/http_probe=true的才进行发现
连通性监测
[root@cinder1 rules]# cat blackbox.yml
groups:
- name: blackbox_network_stats
  rules:
  - alert: blackbox_network_stats
    expr: probe_success == 0
    for: 1m
    labels:
      severity: critical
    annotations:
      summary: "接口/主机/端口 {{ $labels.instance }}  无法联通"
      description: "请尽快检测"
ssl检测
[root@cinder1 rules]# cat ssl.yml
groups:
- name: check_ssl_status
  rules:
  - alert: "ssl证书过期警告"
    expr: (probe_ssl_earliest_cert_expiry - time())/86400 <30
    for: 1h
    labels:
      severity: warn
    annotations:
      description: '域名{{$labels.instance}}的证书还有{{ printf "%.1f" $value }}天就过期了,请尽快更新证书'
      summary: "ssl证书过期警告"
定义prometheusrules:
#kubectl get prometheusrules c-qtpxd -o yaml
  groups:
  - name: c-qtpxd:cag-688v4
    rules:
    - alert: http_request
      annotations:
        current_value: '{{ .Value }}'
      expr: probe_http_status_code!=200
      for: 5m
      labels:
        alert_name: http_request
        alert_type: metric
        cluster_name: 'k8s-prodenv (ID: c-qtpxd)'
        comparison: not equal
        duration: 5m
        expression: probe_http_status_code!=200
        group_id: c-qtpxd:cag-688v4
        rule_id: c-qtpxd:cag-688v4_car-g2zn8
        severity: critical
        threshold_value: "200"
    - alert: 证书有效期
      annotations:
        current_value: '{{ .Value }}'
      expr: (probe_ssl_earliest_cert_expiry - time())/86400<30
      for: 5m
      labels:
        alert_name: 证书有效期
        alert_type: metric
        cluster_name: 'k8s-prodenv (ID: c-qtpxd)'
        comparison: less than
        duration: 5m
        expression: (probe_ssl_earliest_cert_expiry - time())/86400<30
        group_id: c-qtpxd:cag-688v4
        rule_id: c-qtpxd:cag-688v4_car-hpvxh
        severity: critical
        threshold_value: "30"
其他:
probe_dns_lookup_time_seconds:dns解析时间
probe_duration_seconds:探测耗时
probe_failed_due_to_regex:探测是否因regex不匹配而失败
probe_http_content_length:http响应报文内容大小
probe_http_redirects:重定向次数
probe_http_ssl:1-表示最后一次重定向使用到了https
probe_http_status_code: 响应状态码
probe_http_uncompressed_body_length:响应报文的body未压缩情况下的大小
probe_http_version:使用的http版本
probe_ip_addr_hash:IP地址的hash值。用于判断IP地址是否变化
probe_ip_protocol:IP协议版本,取值:4或6,代表ipv4或ipv6
probe_ssl_earliest_cert_expiry:证书过期时间点的时间戳
probe_ssl_last_chain_expiry_timestamp_seconds:证书链过期时间
probe_success:probe是否成功。1-成功;0-不成功
probe_tls_version_info:TLS版本信息(http_version与对应的tls_version取值不一致)
参考文章Prometheus 黑盒监控
前面我们主要介绍了 Prometheus 下如何进行白盒监控,我们监控主机的资源用量、容器的运行状态、数据库中间件的运行数据、自动发现 Kubernetes 集群中的资源等等,这些都是支持业务和服务的基础设施,通过白盒能够了解其内部的实际运行状态,通过对监控指标的观察能够预判可能出现的问题,从而对潜在的不确定因素进行优化。而从完整的监控逻辑的角度,除了大量的应用白盒监控以外,还应该添加适当的 Blackbox(黑盒)监控,黑盒监控即以用户的身份测试服务的外部可见性,常见的黑盒监控包括HTTP 探针、TCP 探针 等用于检测站点或者服务的可访问性,以及访问效率等。
黑盒监控相较于白盒监控最大的不同在于黑盒监控是以故障为导向当故障发生时,黑盒监控能快速发现故障,而白盒监控则侧重于主动发现或者预测潜在的问题。一个完善的监控目标是要能够从白盒的角度发现潜在问题,能够在黑盒的角度快速发现已经发生的问题。
Blackbox Exporter 是 Prometheus 社区提供的官方黑盒监控解决方案,其允许用户通过:HTTP、HTTPS、DNS、TCP 以及 ICMP 的方式对网络进行探测。
同样首先需要在 Kubernetes 集群中运行 blackbox-exporter 服务,同样通过一个 ConfigMap 资源对象来为 Blackbox 提供配置,如下所示:(prome-blackbox.yaml)
apiVersion: v1
kind: ConfigMap
metadata:
  name: blackbox-config
  namespace: kube-mon
data:
  blackbox.yml: |-
    modules:
      http_2xx:  # http 检测模块  Blockbox-Exporter 中所有的探针均是以 Module 的信息进行配置
        prober: http
        timeout: 10s
        http:
          valid_http_versions: ["HTTP/1.1", "HTTP/2"]
          valid_status_codes: [200]  # 这里最好作一个返回状态码,在grafana作图时,有明示---陈刚注释。
          method: GET
          preferred_ip_protocol: "ip4"
      http_post_2xx: # http post 监测模块
        prober: http
        timeout: 10s
        http:
          valid_http_versions: ["HTTP/1.1", "HTTP/2"]
          method: POST
          preferred_ip_protocol: "ip4"
      tcp_connect:  # TCP 检测模块
        prober: tcp
        timeout: 10s
      dns:  # DNS 检测模块
        prober: dns
        dns:
          transport_protocol: "tcp"  # 默认是 udp
          preferred_ip_protocol: "ip4"  # 默认是 ip6
          query_name: "kubernetes.default.svc.cluster.local"
---
apiVersion: apps/v1
kind: Deployment
metadata:
  name: blackbox
  namespace: kube-mon
spec:
  selector:
    matchLabels:
      app: blackbox
  template:
    metadata:
      labels:
        app: blackbox
    spec:
      containers:
      - image: prom/blackbox-exporter:v0.16.0
        name: blackbox
        args:
        - --config.file=/etc/blackbox_exporter/blackbox.yml # ConfigMap 中的配置文件
        - --log.level=error  # 错误级别控制
        ports:
        - containerPort: 9115
        volumeMounts:
        - name: config
          mountPath: /etc/blackbox_exporter
      volumes:
      - name: config
        configMap:
          name: blackbox-config
---
apiVersion: v1
kind: Service
metadata:
  name: blackbox
  namespace: kube-mon
spec:
  selector:
    app: blackbox
  ports:
  - port: 9115
    targetPort: 9115
直接创建上面的资源清单:
$ kubectl apply -f content/monitor/manifests/install/prome-blackbox.yaml
configmap/blackbox-config created
deployment.apps/blackbox created
service/blackbox created
然后需要在 Prometheus 的配置文件中加入对 BlackBox 的抓取设置,如下所示:
apiVersion: v1
kind: ConfigMap
metadata:
  name: prometheus-config
  namespace: kube-mon
data:
  prometheus.yml: |
    global:
      scrape_interval: 15s
      scrape_timeout: 15s
    scrape_configs:
    - job_name: 'prometheus'
      static_configs:
      - targets: ['localhost:9090']

    - job_name: "kubernetes-service-dns"
      metrics_path: /probe # 不是 metrics,是 probe
      params:
        module: [dns] # 使用 DNS 模块
      static_configs:
      - targets:
        - kube-dns.kube-system:53  # 不要省略端口号
      relabel_configs:
      - source_labels: [__address__]
        target_label: __param_target  #真正的被scrape的instance,而不是blackbox-export
      - source_labels: [__param_target]
        target_label: instance
      - target_label: __address__
        replacement: blackbox:9115  # 服务地址,和上面的 Service 定义保持一致
首先获取 targets 实例的 __address__ 值写进 __param_target,__param_<name> 形式的标签里的 name 和它的值会被添加到发送到黑盒的 http 的 header 的 params 当作键值,例如__param_target对应params 里的target ,再例如 __param_module 对应 params 里的module。然后获取 __param_target 的值,并覆写到 instance 标签中,覆写 Target 实例的 __address__ 标签值为 BlockBox Exporter 实例的访问地址,向 blackbox:9115 发送请求获取实例的 metrics 信息。
然后更新配置:
$ kubectl apply -f prometheus-cm.yaml
configmap/prometheus-config configured
# 隔一会儿执行 reload 操作
$ curl -X POST "http://10.244.3.174:9090/-/reload"  # promethues pod ip
打开 Prometheus 的 Target 页面,就会看到 上面定义的 kubernetes-service-dns 任务了:
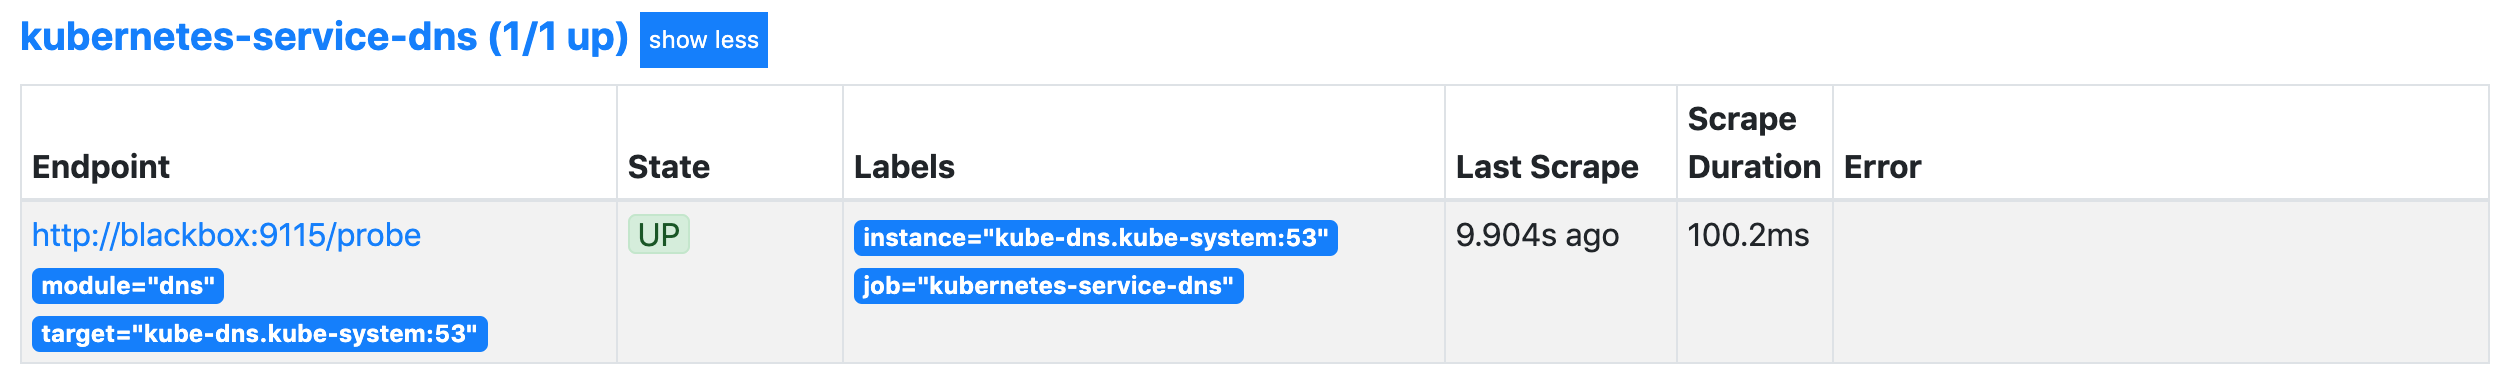
回到 Graph 页面,可以使用 probe_success{job="kubernetes-service-dns"} 来查看检测结果,这样就实现了对 DNS 的黑盒监控。 除了 DNS 的配置外,上面我们还配置了一个 http_2xx 的模块,也就是 HTTP 探针,HTTP 探针是进行黑盒监控时最常用的探针之一,通过 HTTP 探针能够对网站或者 HTTP 服务建立有效的监控,包括其本身的可用性,以及用户体验相关的如响应时间等等。除了能够在服务出现异常的时候及时报警,还能帮助系统管理员分析和优化网站体验。这里我们可以使用他来对 http 服务进行检测。
因为前面已经给 Blackbox 配置了 http_2xx 模块,所以这里只需要在 Prometheus 中加入抓取任务,这里我们可以结合前面的 Prometheus 的服务发现功能来做黑盒监控,对于 Service 和 Ingress 类型的服务发现,用来进行黑盒监控是非常合适的,配置如下所示:
- job_name: 'kubernetes-http-services'
  metrics_path: /probe
  params:
    module: [http_2xx]  # 使用定义的http模块
  kubernetes_sd_configs:
  - role: service  # service 类型的服务发现
  relabel_configs:
  # 只有service的annotation中配置了 prometheus.io/http_probe=true 的才进行发现
  - source_labels: [__meta_kubernetes_service_annotation_prometheus_io_http_probe]
    action: keep
    regex: true
  - source_labels: [__address__]
    target_label: __param_target
  - target_label: __address__
    replacement: blackbox:9115
  - source_labels: [__param_target]
    target_label: instance
  - action: labelmap
    regex: __meta_kubernetes_service_label_(.+)
  - source_labels: [__meta_kubernetes_namespace]
    target_label: kubernetes_namespace
  - source_labels: [__meta_kubernetes_service_name]
    target_label: kubernetes_name

- job_name: 'kubernetes-ingresses'
  metrics_path: /probe
  params:
    module: [http_2xx]  # 使用定义的http模块
  kubernetes_sd_configs:
  - role: ingress  # ingress 类型的服务发现
  relabel_configs:
  # 只有ingress的annotation中配置了 prometheus.io/http_probe=true的才进行发现
  - source_labels: [__meta_kubernetes_ingress_annotation_prometheus_io_http_probe]
    action: keep
    regex: true
  - source_labels: [__meta_kubernetes_ingress_scheme,__address__,__meta_kubernetes_ingress_path]
    regex: (.+);(.+);(.+)
    replacement: ${1}://${2}${3}
    target_label: __param_target
  - target_label: __address__
    replacement: blackbox:9115
  - source_labels: [__param_target]
    target_label: instance
  - action: labelmap
    regex: __meta_kubernetes_ingress_label_(.+)
  - source_labels: [__meta_kubernetes_namespace]
    target_label: kubernetes_namespace
  - source_labels: [__meta_kubernetes_ingress_name]
    target_label: kubernetes_name
我们结合前面的服务发现功能,通过过滤 prometheus.io/http_probe=true 的 Service 和 Ingress 才进行 HTTP 探针类型的黑盒监控,其他配置和上面配置 dns 监控的时候是一致的。然后更新配置:
$ kubectl apply -f prometheus-cm.yaml
configmap/prometheus-config configured
# 隔一会儿执行reload操作
$ curl -X POST "http://10.244.3.174:9090/-/reload"
打开 Prometheus 的 Target 页面,就会看到上面定义的两个任务了:
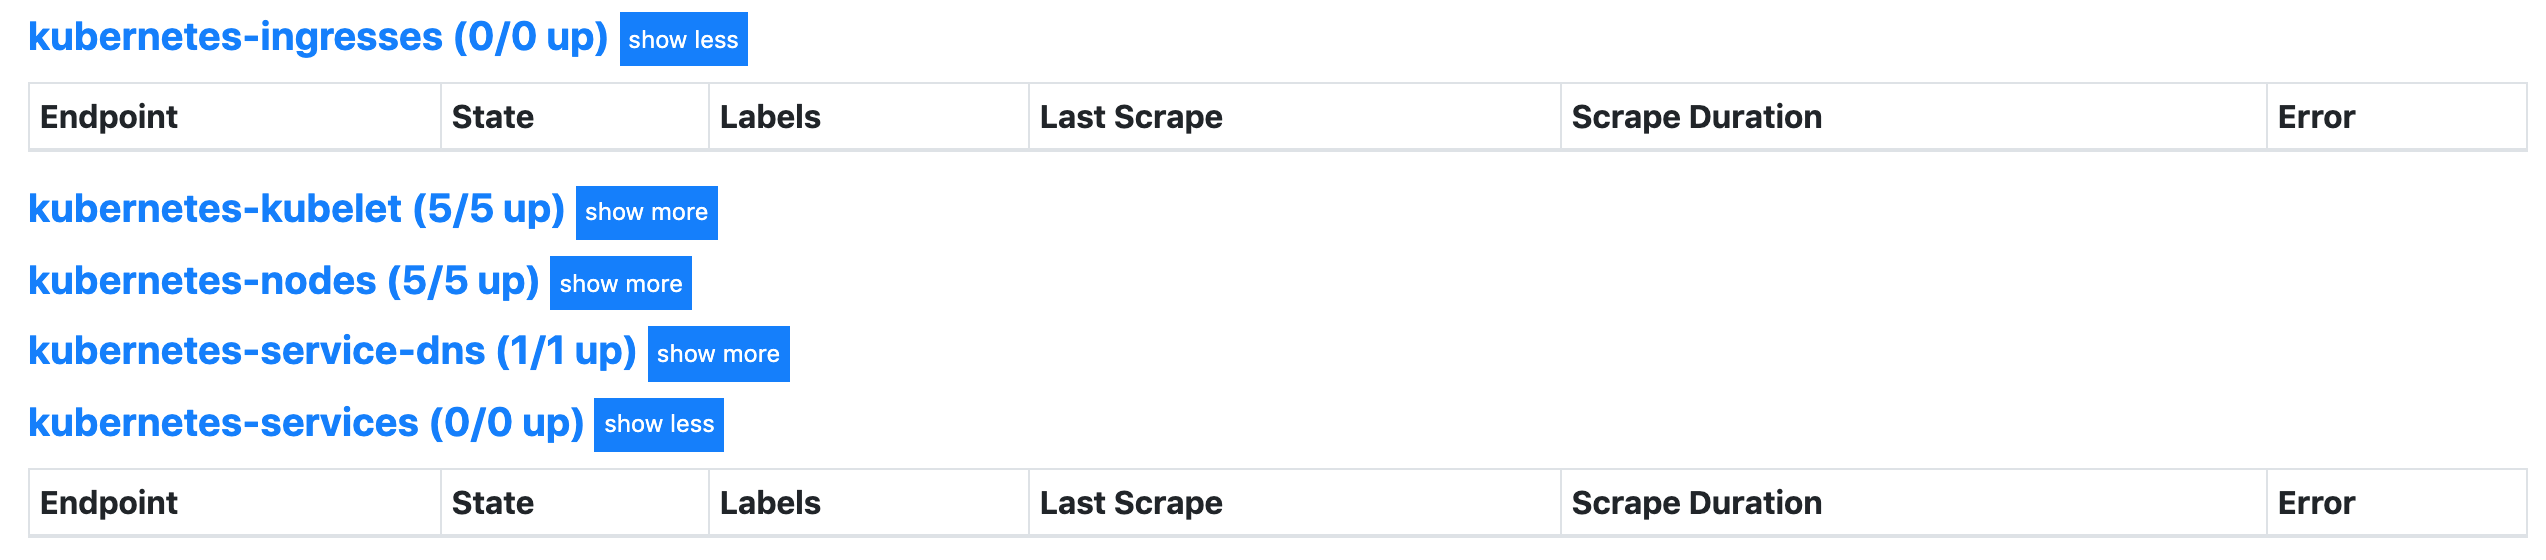
但是现在还没有任何数据,这是因为上面是匹配 __meta_kubernetes_ingress_annotation_prometheus_io_http_probe 这个元信息,所以如果我们需要让这两个任务发现的话需要在 Service 或者 Ingress 中配置对应的 annotation:
annotation:
  prometheus.io/http-probe: "true"
比如在我们自己的一个 Ingress 对象中添加上面这个 annotation:
$  kubectl get ingress fe-trait-ingress -o yaml
apiVersion: extensions/v1beta1
kind: Ingress
metadata:
  annotations:
    ......
    prometheus.io/http-probe: "true"  # 用于黑盒监控
......
spec:
  rules:
  - host: todo.qikqiak.com
    http:
      paths:
      - backend:
          serviceName: fe
          servicePort: 3000
        path: /app(/|$)(.*)
status:
  loadBalancer: {}
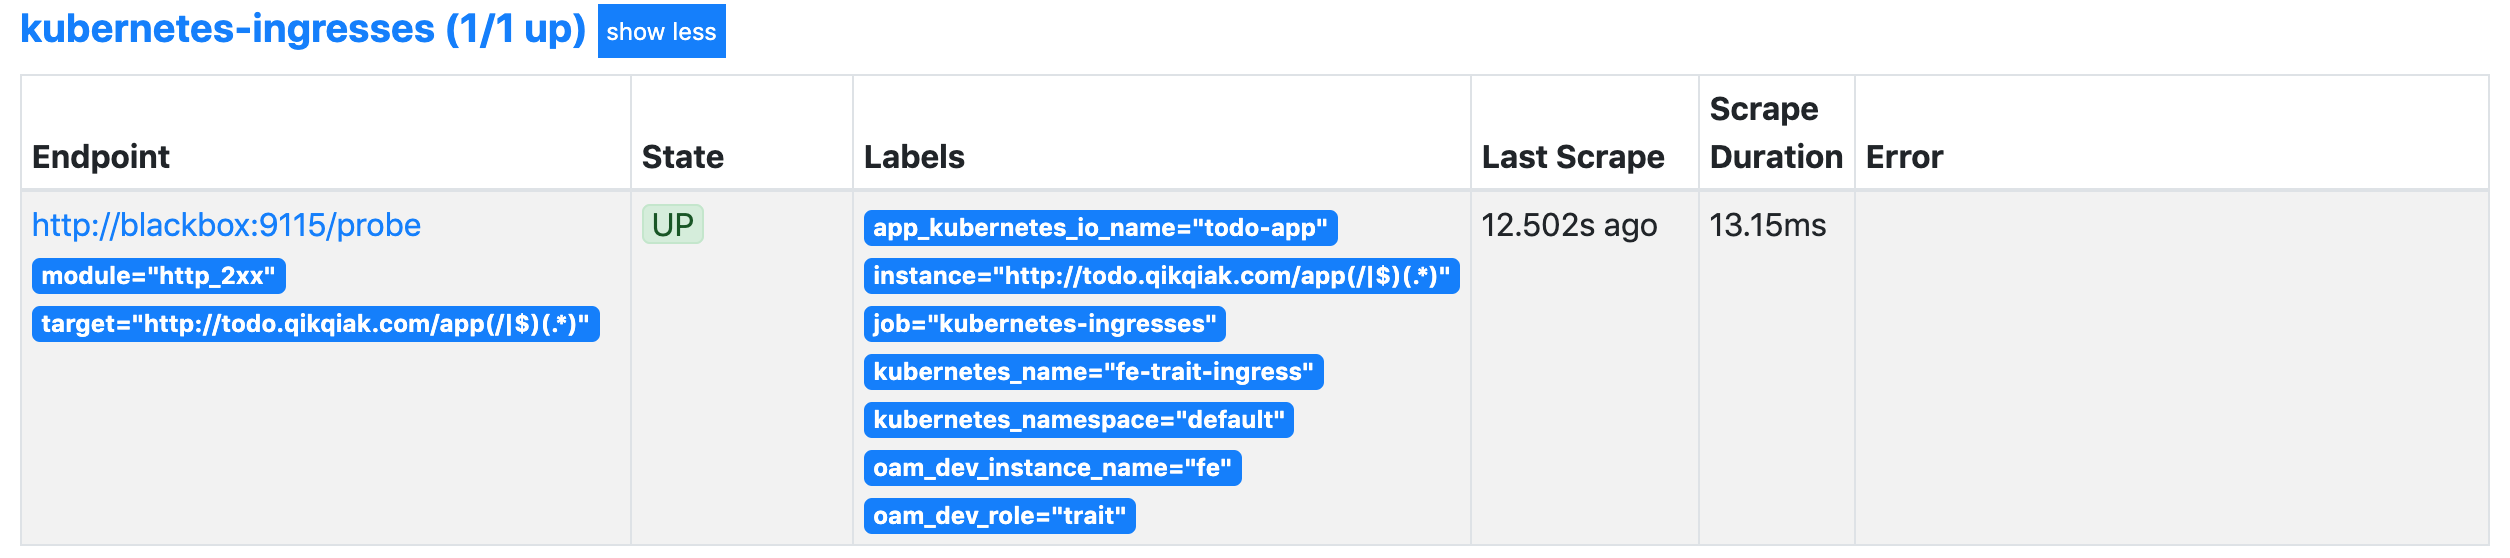
这个时候我们查看到 Ingress 这个任务下面已经有抓取任务了:
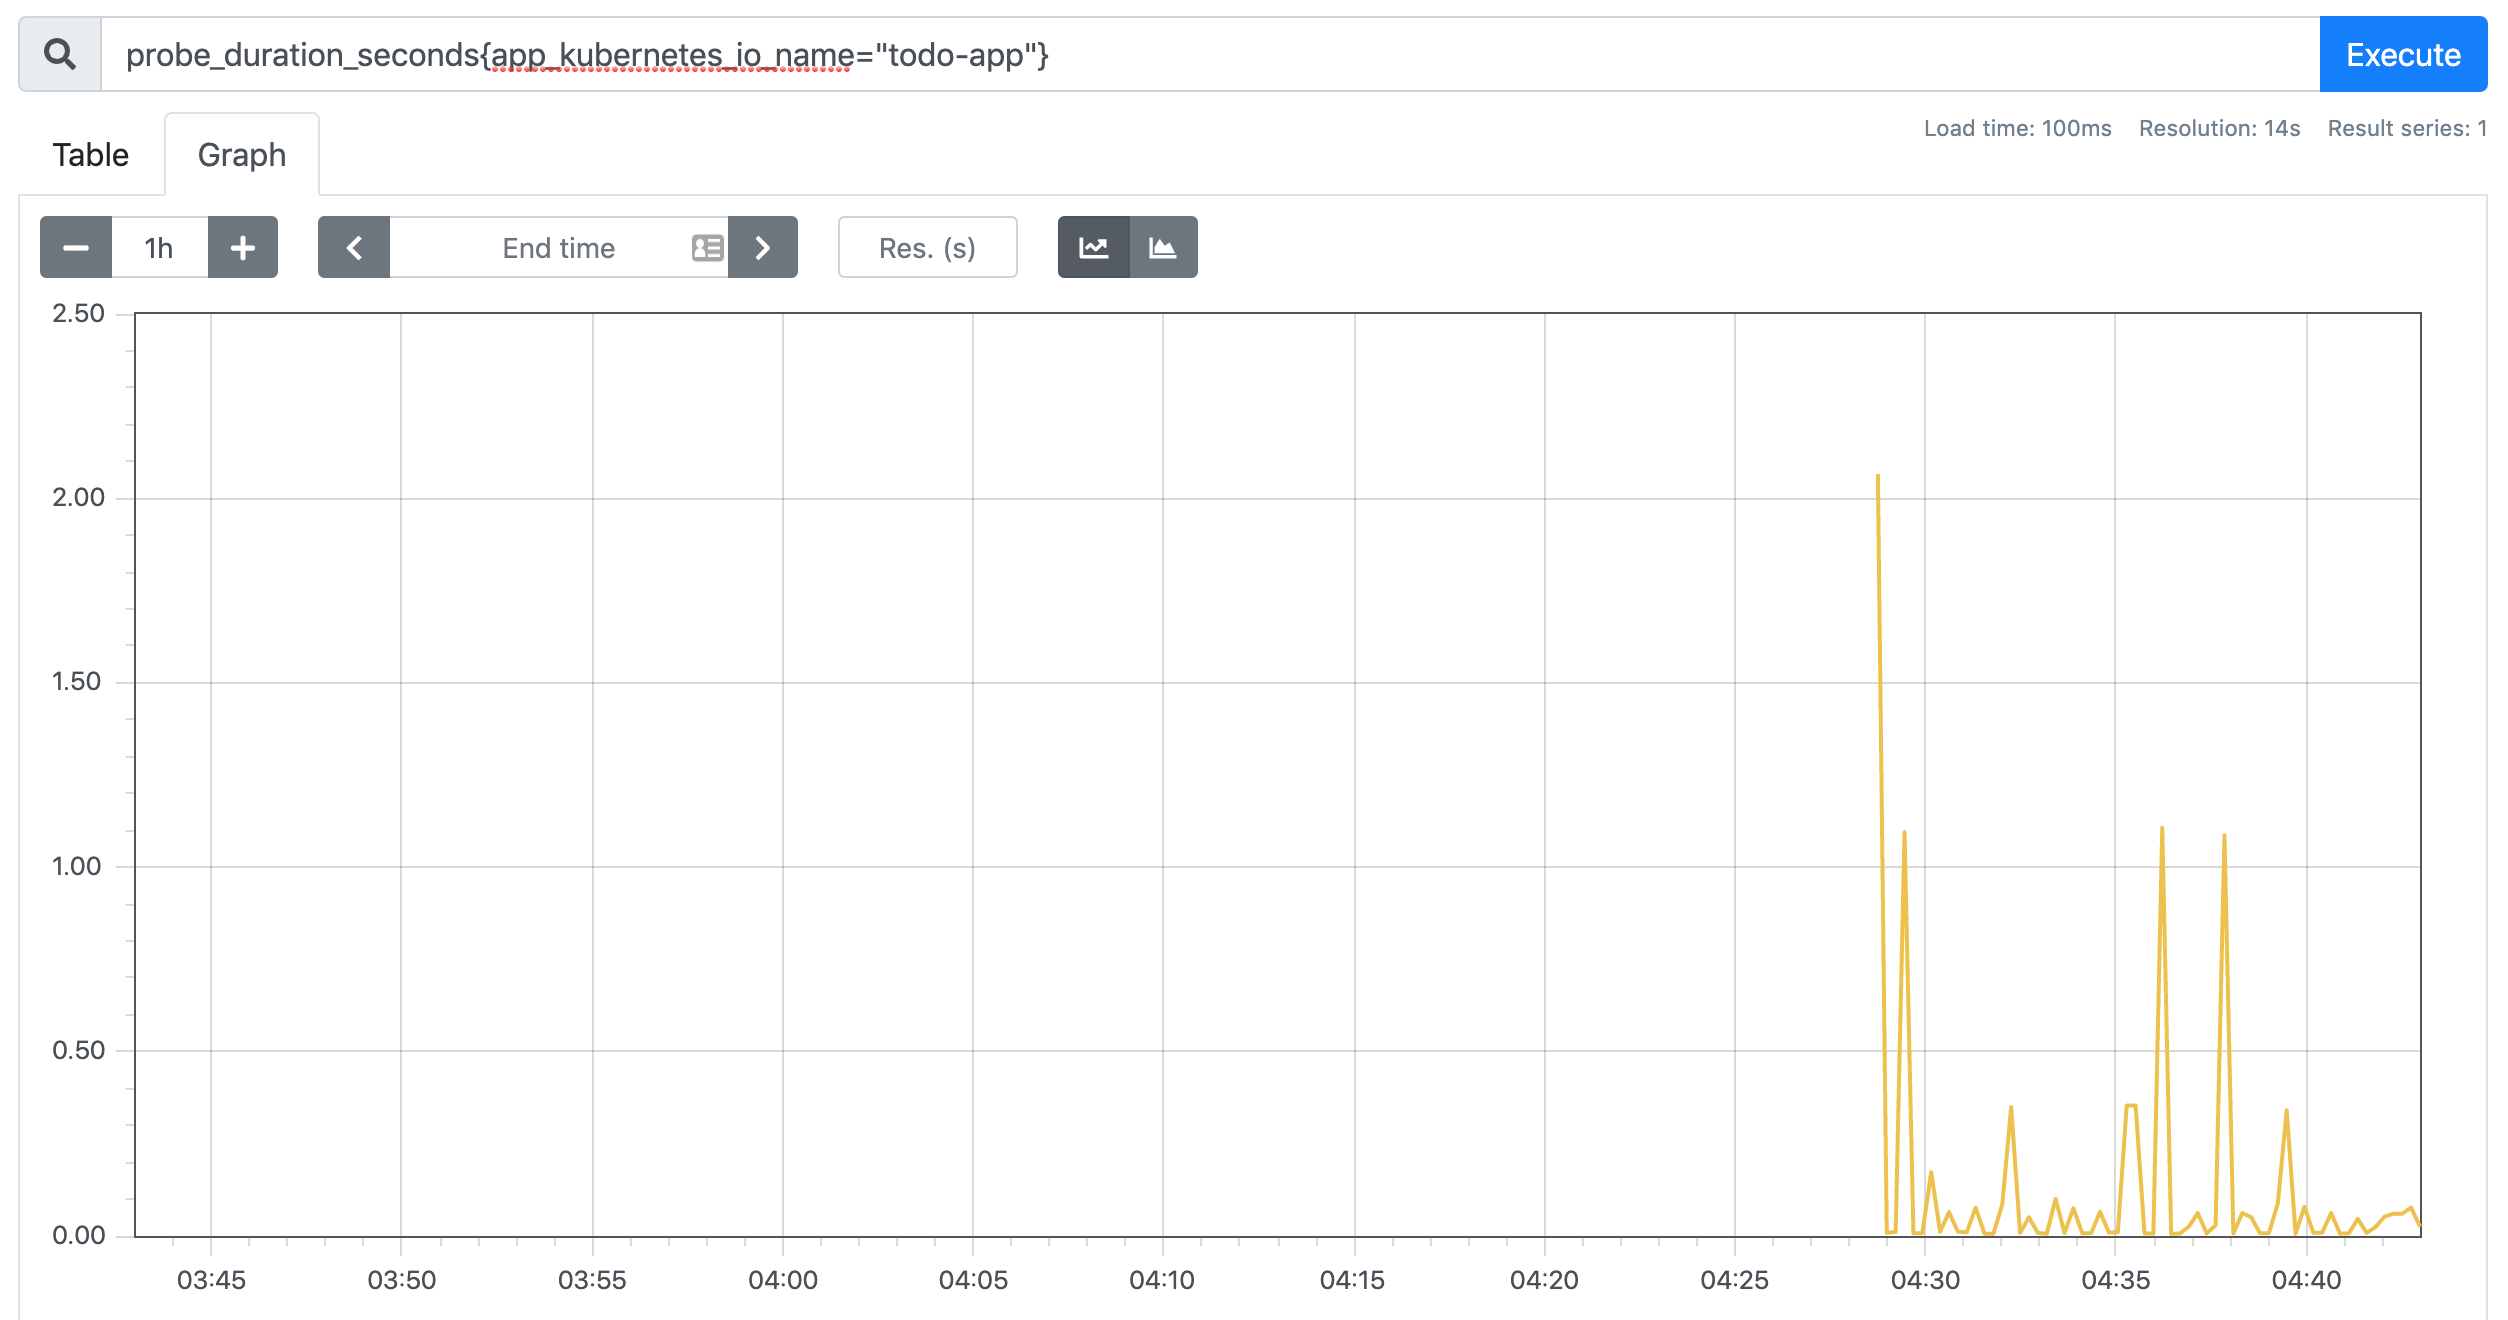
比如现在我们可以使用 probe_duration_seconds 来检查监控结果:
对于 Service 是一样的,当然如果你需要对监控的路径、端口这些做控制,我们可以自己在 relabel_configs 中去做相应的配置,比如我们想对 Service 的黑盒做自定义配置,可以想下面这样配置:
- source_labels: [__meta_kubernetes_service_name, __meta_kubernetes_namespace, __meta_kubernetes_service_annotation_prometheus_io_http_probe_port, __meta_kubernetes_service_annotation_prometheus_io_http_probe_path]
  action: replace
  target_label: __param_target
  regex: (.+);(.+);(.+);(.+)
  replacement: $1.$2:$3$4
这样我们就需要在 Service 中配置这样的 annotation 了:
annotation:
  prometheus.io/http-probe: "true"
  prometheus.io/http-probe-port: "8080"
  prometheus.io/http-probe-path: "/healthz"
这样我们就完成了 HTTP 探针的黑盒监控,除此之外,我们还可以配置 TCP 的监控,上面我们已经配置了这个模块,大家可以自己尝试去配置下。
除了支持对 HTT P协议进行网络探测以外,Blackbox 还支持对 TCP、DNS、ICMP 等其他网络协议,感兴趣的读者可以从 Blackbox 的 Github 项目中获取更多使用信息。